Worklist X/Y
worklist.xy
worklist.xy data queries plot two dimensional data to visualize clusters or correlations.
Inputs
Each series.* should provide:
label:(human-friendly series name for visualizations)of:(record type)x:field(@year,month,day,hour,minute,second)x.metric:(an equation to apply to each x-axis value; 9.1.6 or later)y:(field)y.metric:(an equation to apply to each y-axis value; 9.1.6 or later)query:(the query to filter the results for this series)query.required:(the required query to filter the results for this series)
You can specify a limit: and sort: within each series query:(). Nested sorting is supported, and sorts can be in ascending or descending order by prefixing a minus (-) to the field name for descending.
Response Formats
-
pie format returns data for pie and donut charts.
-
categories returns series-based data suitable for bar charts.
-
scatterplot (default) returns series-based data suitable for a scatterplot chart.
-
table returns data in a tabular (rows/columns) format suitable for "Chart: Table" visualization widgets.
Examples
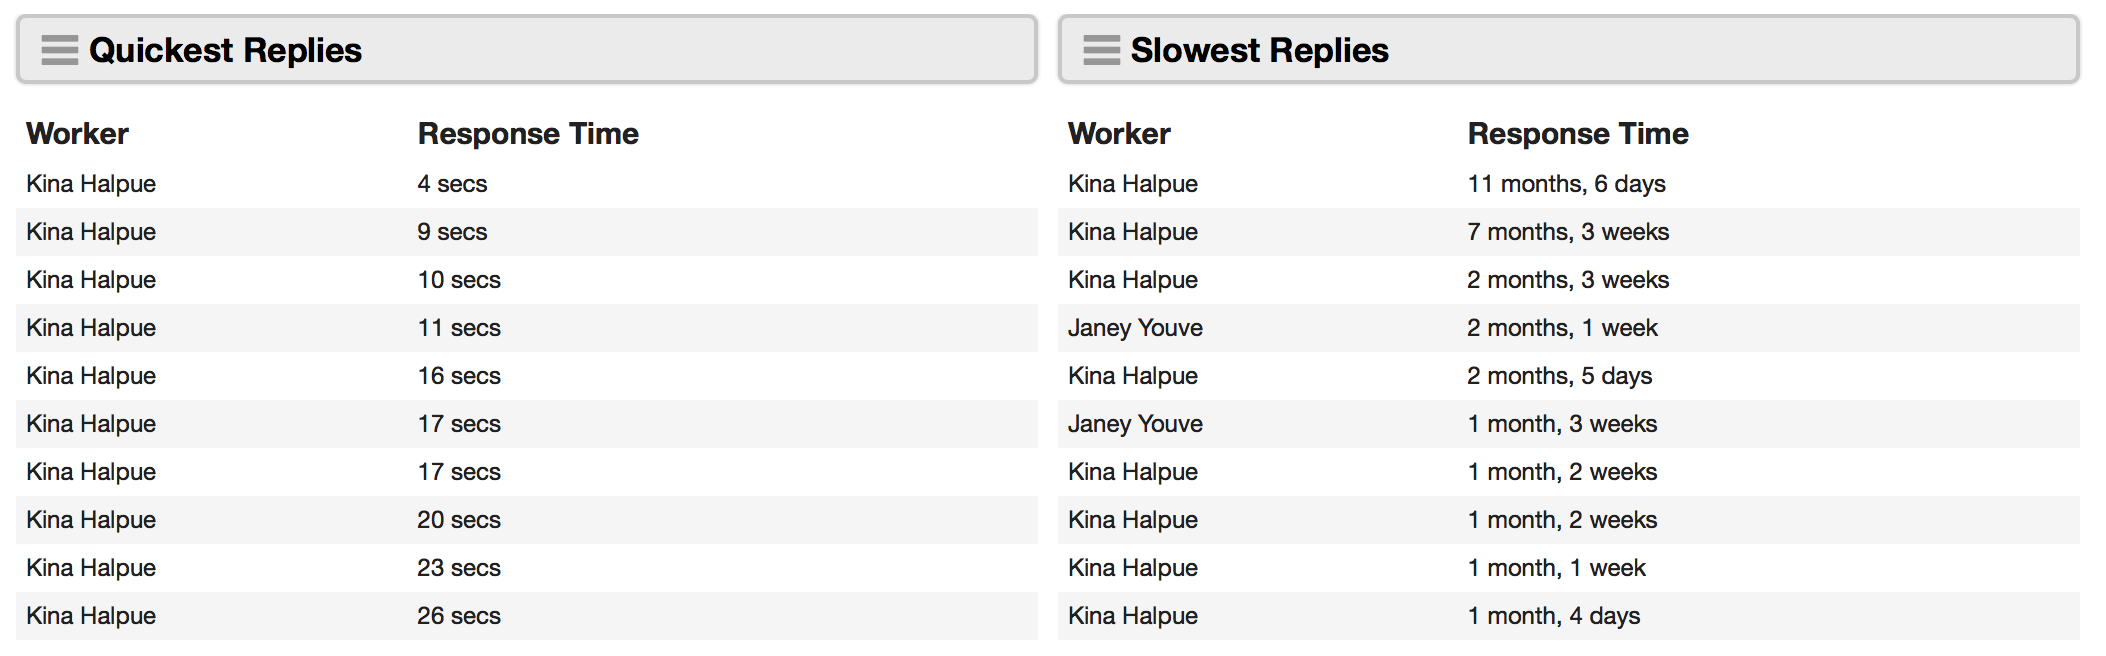
Generate a table of the top 10 quickest message response times
type:worklist.xy
series.replies:(
  of:messages
  x:worker
  y:responseTime
  query:(
  	responseTime:>0
    sort:responseTime
    limit:10
  )
)
format:table