9.0

Cerb (9.0) is a platform upgrade released on August 6, 2018. It includes more than 175 new features and improvements from community feedback.
- Important Release Notes
- Customizable Record Profiles
- Build dashboards on profiles
- Flexible widget widths
- Responsive dashboards
- Dashboard widgets
- Record Fields
- Worklists
- Project Boards
- Behavior Tree
- Calendar
- Calendar Availability
- Chart: Categories
- Chart: Pie
- Chart: Scatterplot
- Chart: Table
- Chart: Time Series
- Data Query Visualization
- Knowledgebase Article
- Comments
- HTML/Javascript
- Responsibilities
- Ticket Conversation
- Spam Analysis
- Custom (Bot-powered)
- Permalinks
- Keyboard shortcuts
- Comments
- Mobile
- Data Queries
- Workspaces
- Cards
- File Uploads
- Bots
- Quick search
- Records
- Created dates on custom records
- Records configuration
- Permalinks for drafts
- Custom fieldset improvements
- Cards, profile pages, and worklists for scheduled behaviors
- Cards, profile pages, and worklists for time tracking activities
- Contact autocompletion
- Miscellaneous improvements
- Removed legacy features
- UI
- Platform
To check if you qualify for this release as a free update, view Setup » Configure » License. If your software updates expire on or after June 30, 2018 then you can upgrade without renewing your license. Cerb Cloud subscribers will be upgraded automatically.
Important Release Notes
-
Cerb 9.0 requires PHP 7.0+ and MySQL 5.6+.
-
To upgrade your installation, follow these instructions.
Backwards incompatible changes
-
On dashboard, the legacy chart widgets are now deprecated. Existing widgets will continue to display, but new widgets of these types can't be created. These have been replaced by data queries and the new chart visualizations. You should migrate your existing chart widgets to the new style.
-
The "Mobile" plugin has been retired. The primary Cerb interface will now automatically adapt to the smaller screens on mobile devices.
-
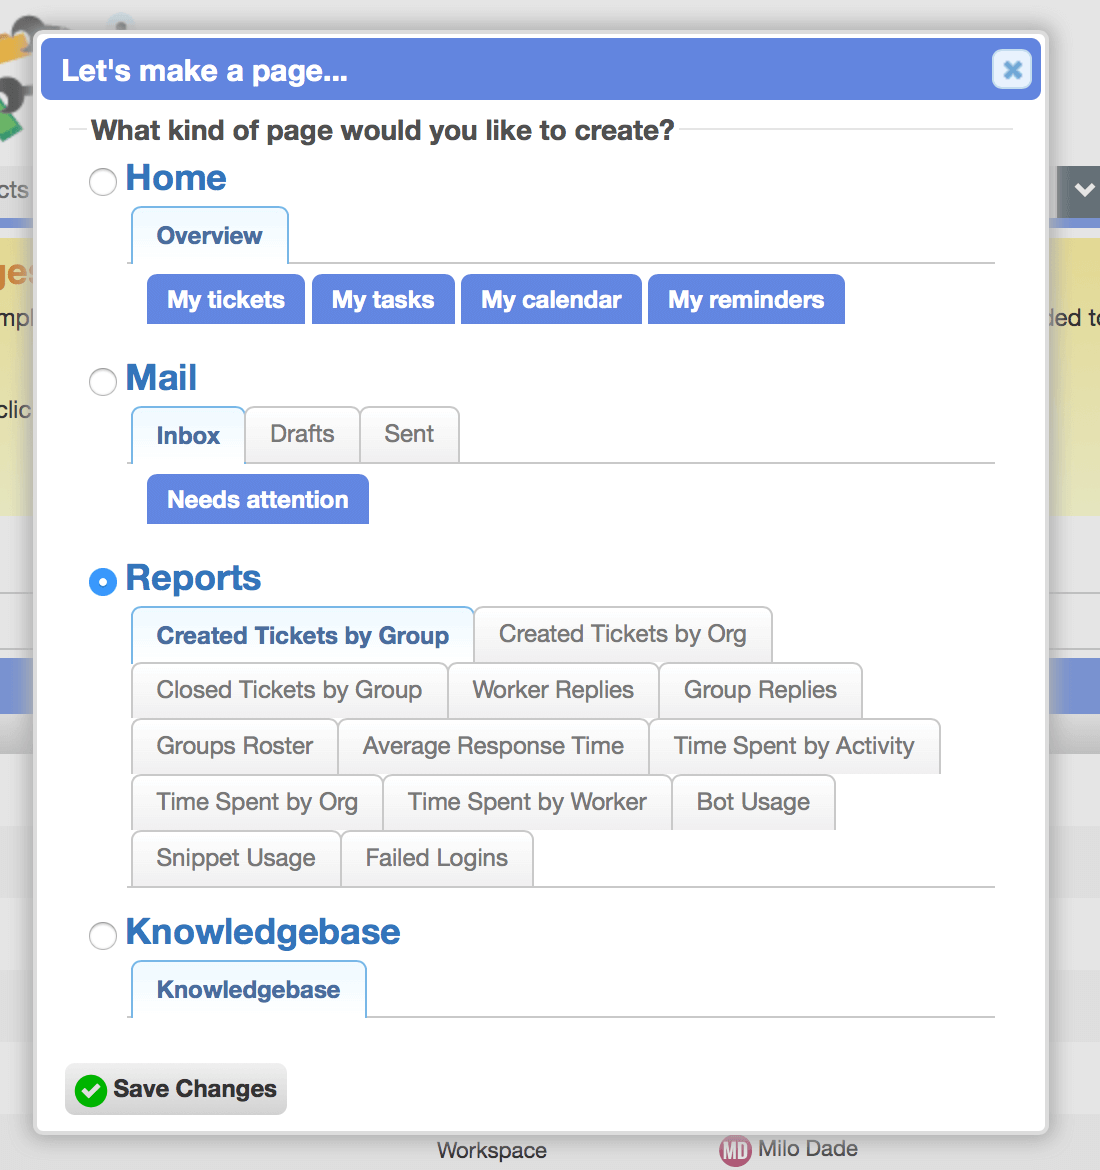
The "Reports" plugin has been retired in favor of the latest major dashboard improvements. You can create a new 'Reports' page from the "Help me create a page" wizard. This takes advantage of the new "data queries" feature, and provides many new visualizations. You can now modify or extend these reports as needed.
-
On worklists, all filtering is now done with quick search queries. Selecting from the "Filters" dropdown has been removed. You may need to modify worklist widgets that weren't previously updated to use filter queries. The old style of filtering was deprecated there in 8.x. These widget labels will be marked with a
(!), and notes about their old filters are preserved.
Customizable Record Profiles
Admins can now customize the tabs that appear on the profile page of any record type – entirely from the web browser. Previously, adding a new tab to a profile required the use of plugins.
All of the previously built-in tabs on profiles have been converted to 'Profile Tab' records and are now editable.
When you add a new tab to a profile, it will be visible on all other records of the same type. For instance, you can add an 'Orders' tab to all ticket profiles, and its contents can display the order history of the participants for each ticket you view.
This is especially useful for custom records, which barely made use of profiles before.
Profile tabs can be dragged into any order. The first tab is the default.
New types of profile tabs can be added with plugins. We've included several to help you get started.
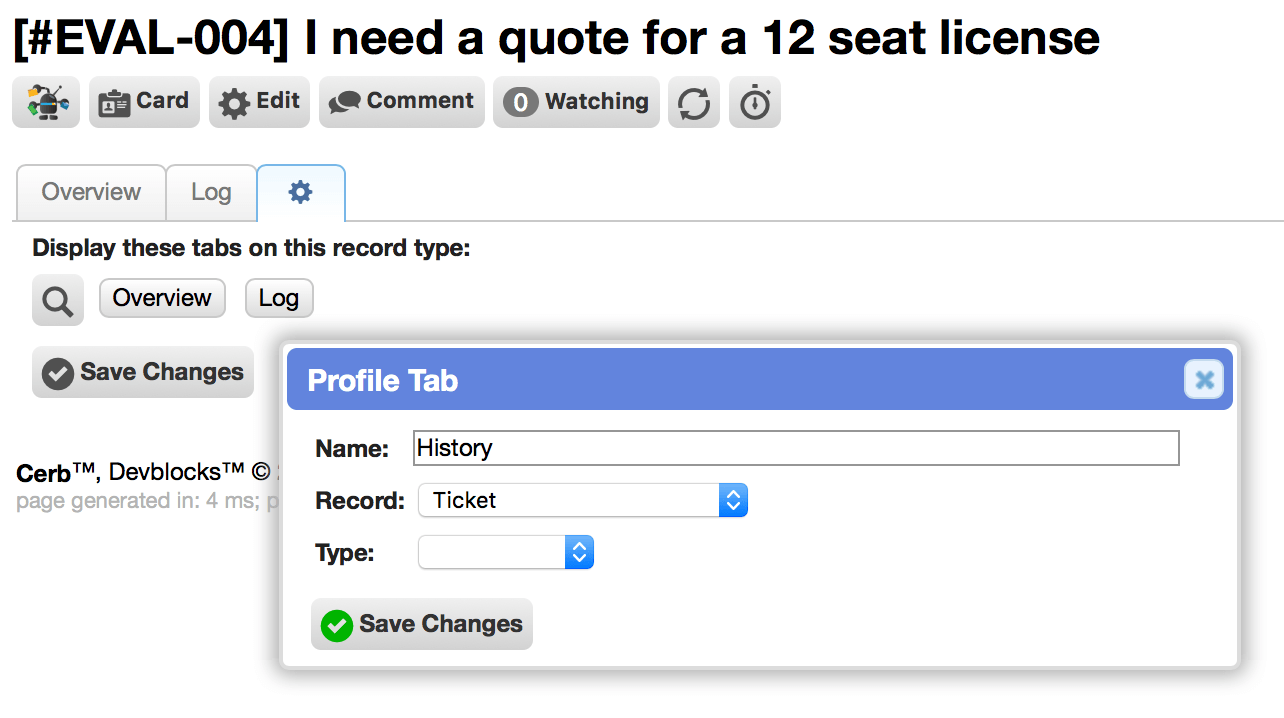
You can configure a profile's tabs from the gear icon at the end of the tab set:
Build dashboards on profiles
Dashboards are our first new profile tab type. They are a collection of visualization "widgets". [#655]
Profile dashboards are similar to workspace dashboards; but the dashboard on a profile has access to all of the current record's placeholders. You can design a dashboard once for a specific record type and it will automatically adapt every time you view a different record.
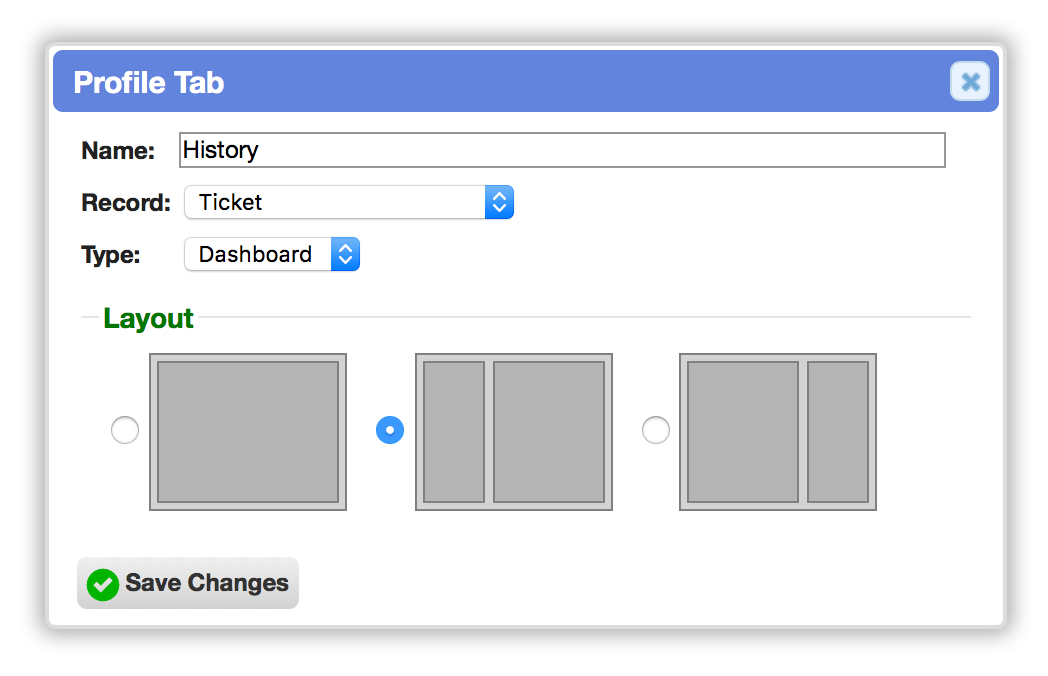
Each dashboard has a layout for positioning the widgets. Layouts are a series of "zones".
For instance, a "sidebar" and "main content" area are two zones. Zones are named, so that switching between compatible zones (e.g. left-sidebar, right-sidebar) keeps the widgets in their proper place as the entire zone moves. When widgets aren't assigned to an existing zone after the layout changes, they are added to the first zone.
When dragging widgets, the zones are highlighted. This is particularly useful when you want to have one large widget (like a ticket conversation) with a sidebar containing several summary widgets. This wasn't possible with the previous grid-based design where the columns were always the same width.
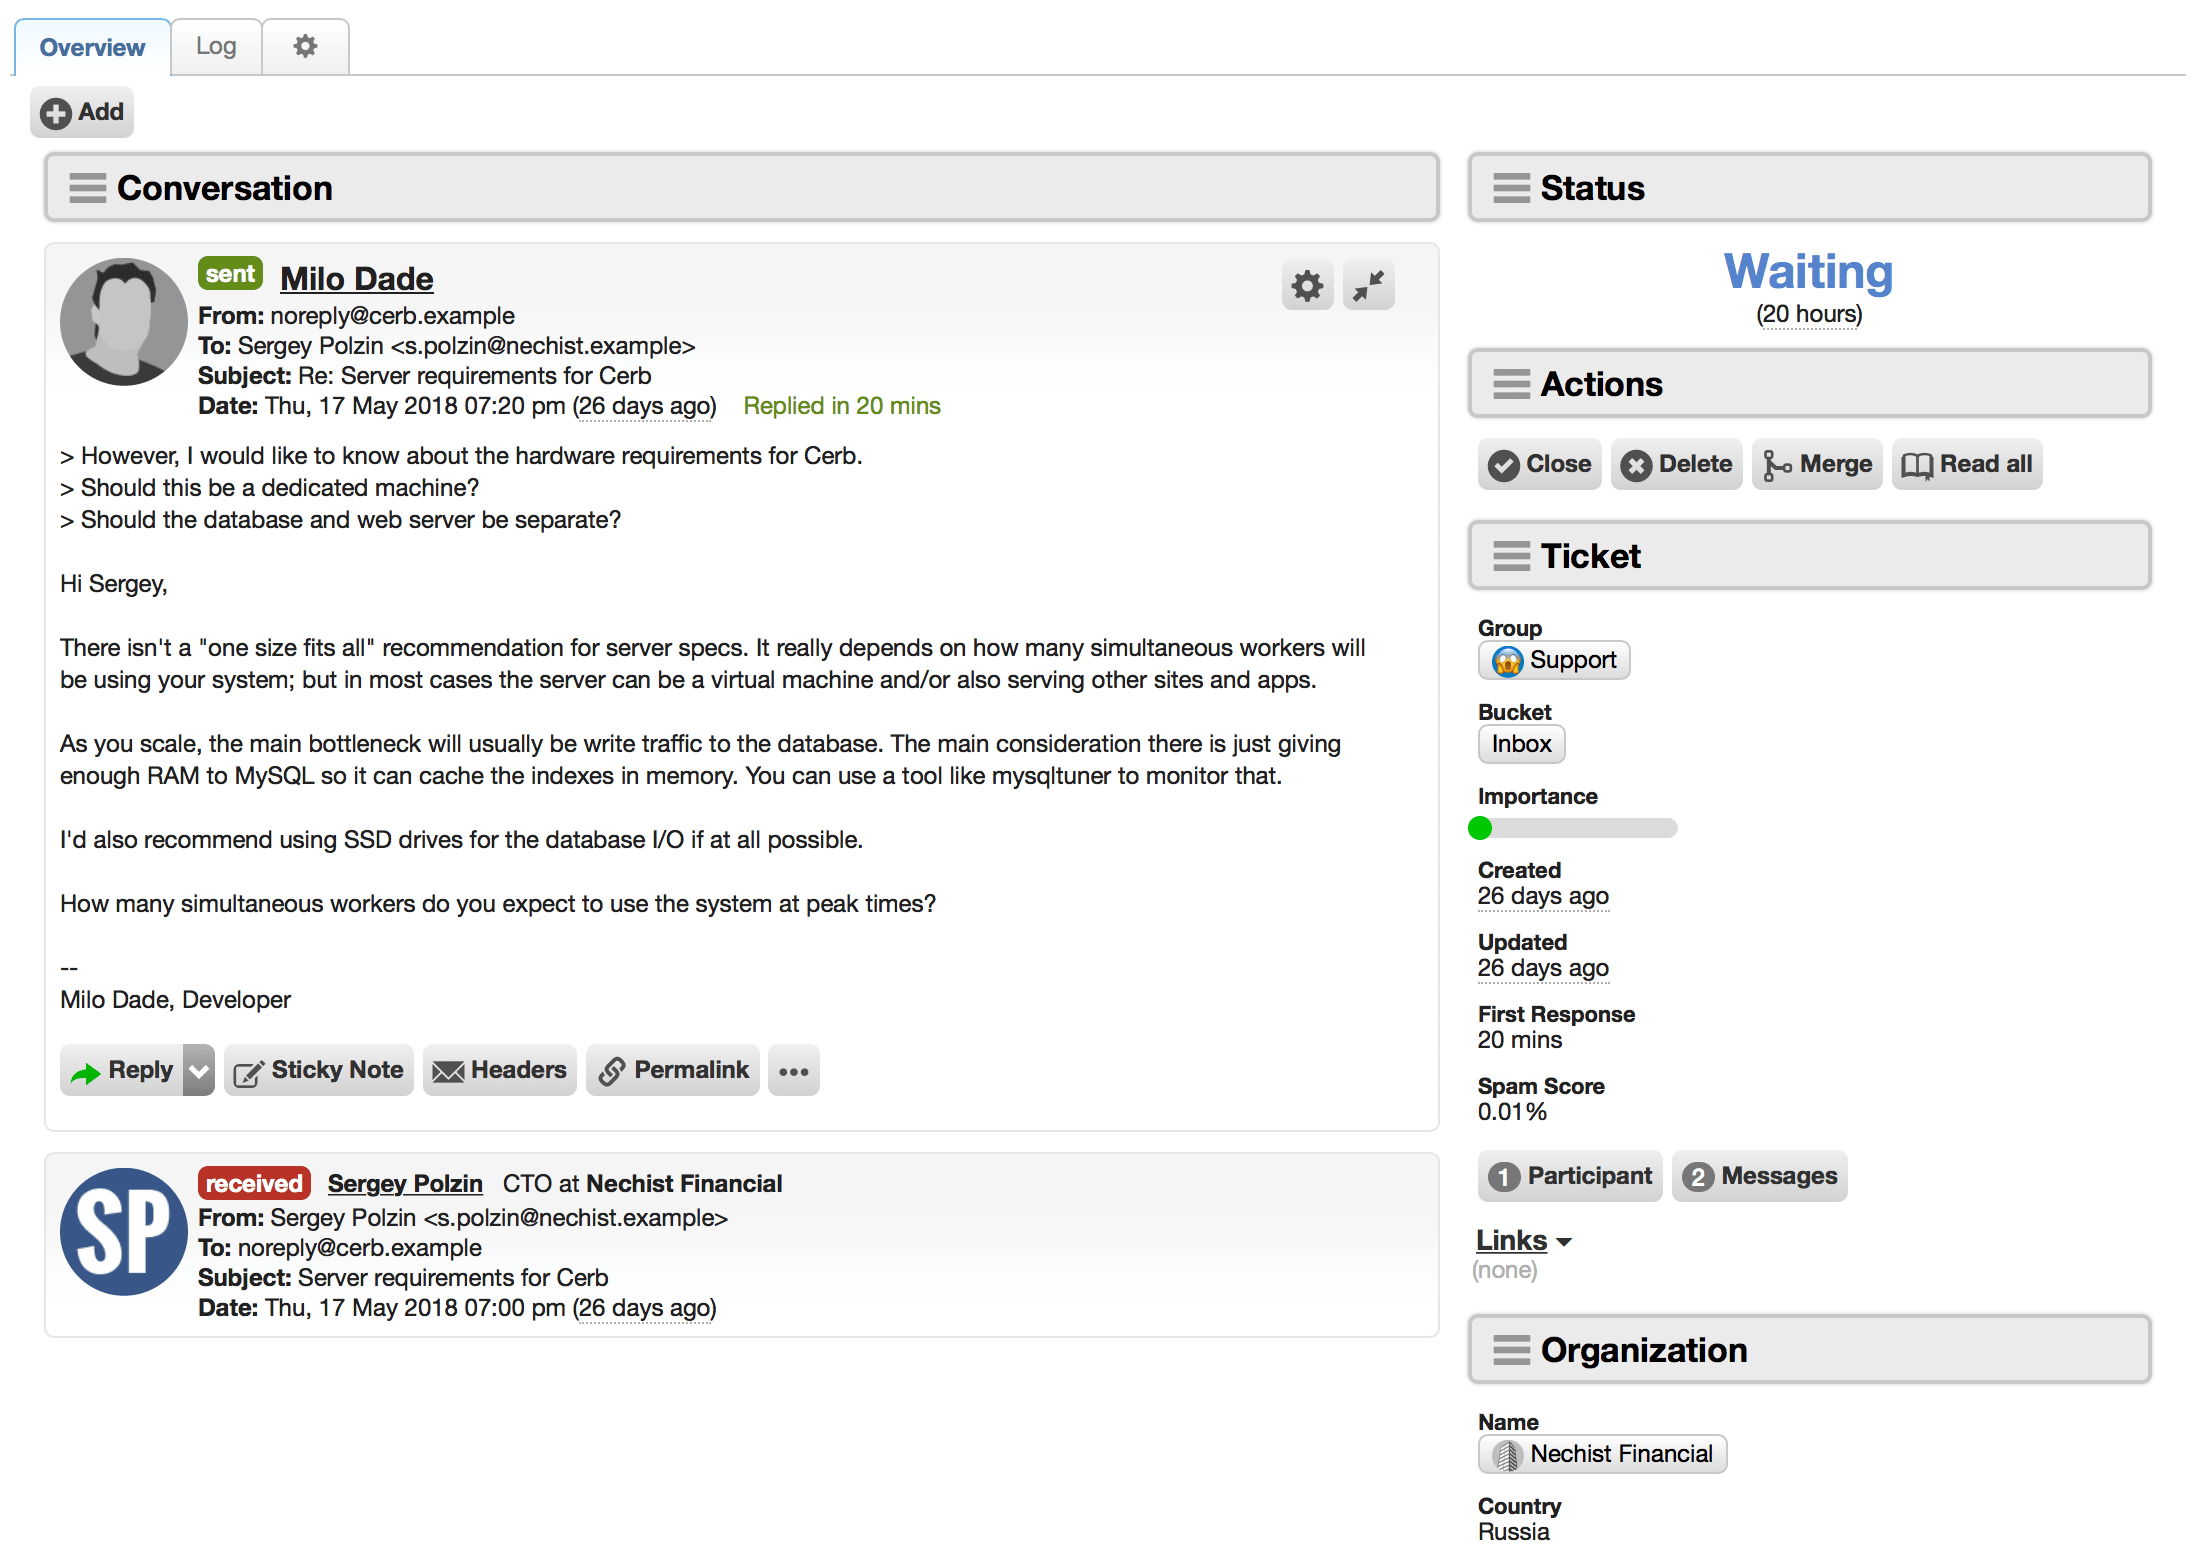
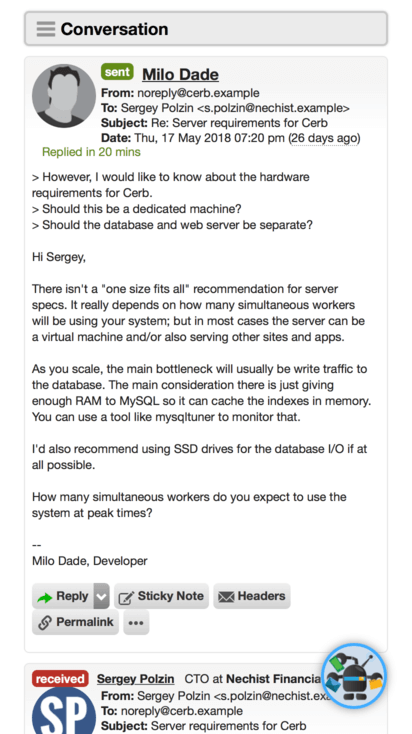
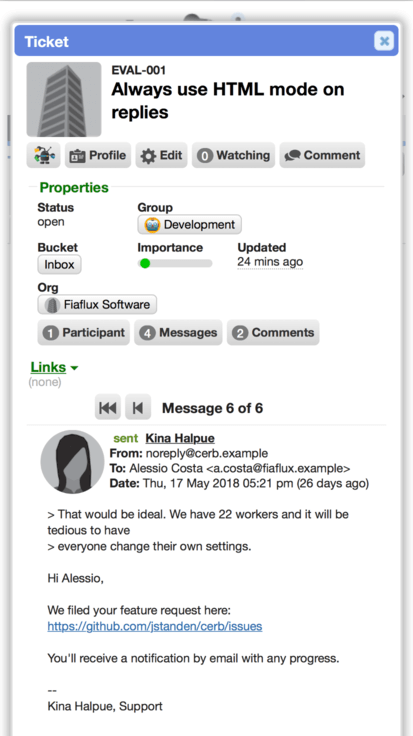
Here's what ticket profiles look like now using the default "right-sidebar" layout:
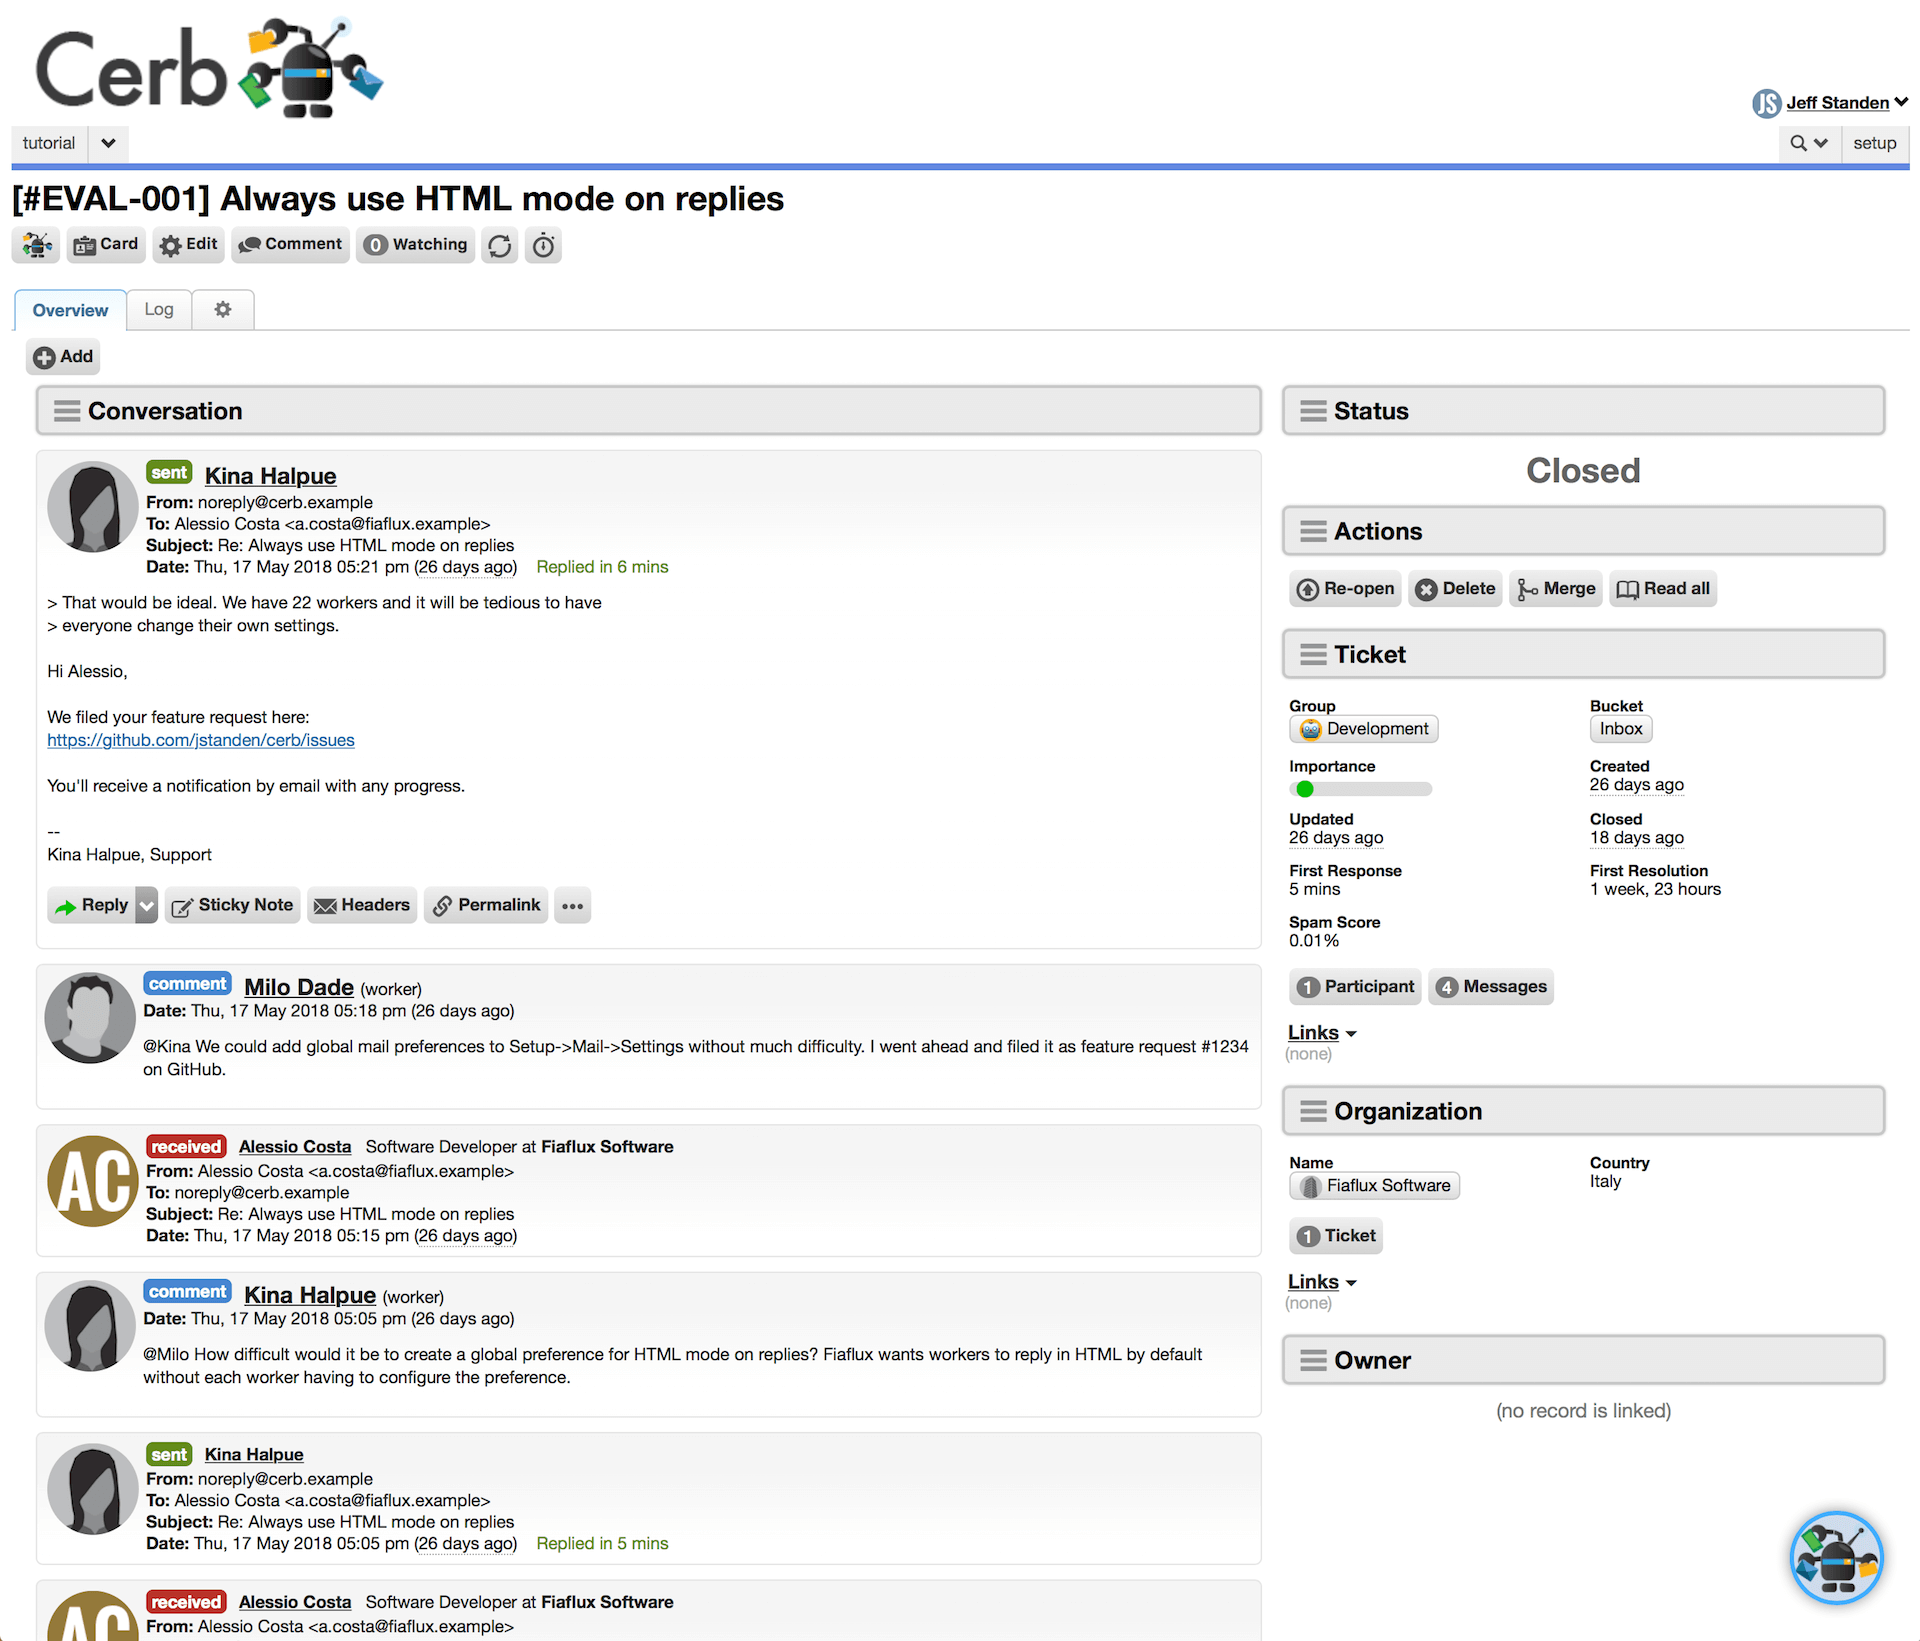
In past versions, when many custom fieldsets were used, it often required a lot of scrolling to see the start of each conversation. Now, conversations are displayed right away in the large content area on the left. The conversation history is also a widget now, so it can include configuration options, and you can move it around or resize it as desired.
In the smaller sidebar area on the right, we provide full record summaries of the current ticket, its organization, and owner. This reduces the need to open cards when reviewing a record from its profile. You can also easily move the sidebar to the left by editing the dashboard and switching layouts.
We'll talk more about the record fields widgets below.
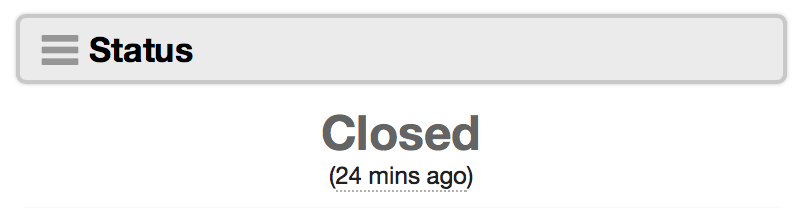
At the top of the sidebar, we've included a widget to make the status of the ticket much more obvious at a glance. If there's a re-open date set, you'll see it there as well.
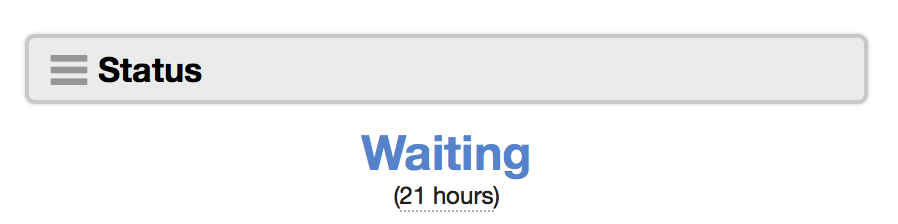
We do the same thing with task and opportunity records by default. Previously, the current status of each record was buried in the properties list. These widgets are completely editable, so you can copy or modify them to meet your specific needs (or even just delete them and add the status field back to the ticket properties).
Below the new status widget, you'll find the record-specific actions.
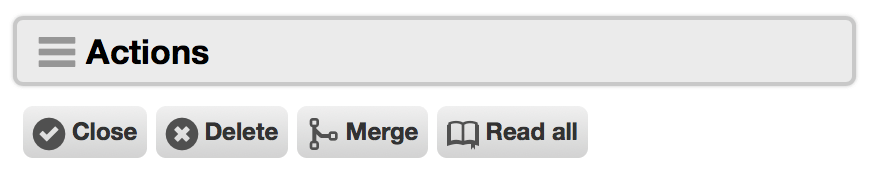
These used to appear at the top of the profile, but they weren't configurable, and were inconsistent for different record types.
Admins can now edit the actions widget to add new shortcuts (including keyboard shortcuts). The "Read all" action is also more efficient – it quickly refreshes the "Conversation" widget with every message expanded in chronological order, without requiring a full page reload.
Flexible widget widths
Widgets on profile dashboards can be configured to span multiple column widths (e.g. 25%, 50%, 75%, 100%).
For instance, a large chart or worklist can be 2-4X wider than the widgets around it.
Previously, workspace dashboards required that all widgets and columns were the same width.
Responsive dashboards
Profile dashboards follow responsive design principles. A narrow display width will result in a single column, while a wide dedicated screen could display many more. Widgets grow and shrink according to the space available.
Widgets can be dragged into a preferred order. Widgets are wrapped horizontally (rather than vertically) so the most frequently viewed widgets always occur near the top of the page regardless of the number of columns.
Here we have a ticket profile on a screen that's slightly narrower than the above example (perhaps an iPad in landscape mode):
You'll see that the widgets in the sidebar now display their fields in a single column, where above there were two columns of fields.
Here's the same profile on a much narrower screen (like an iPhone in portrait):
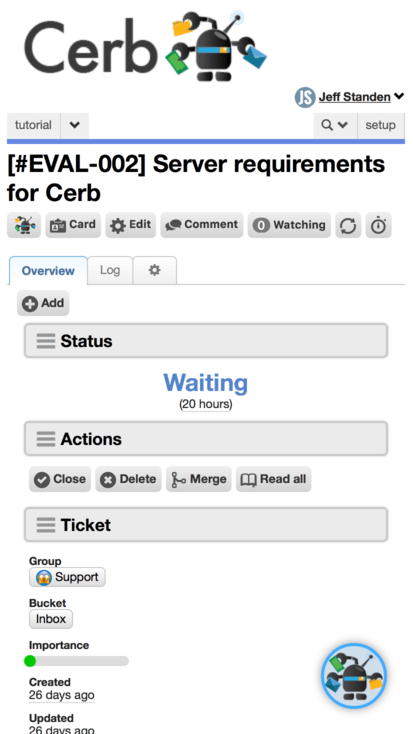
The widgets now display in a single column, and the right sidebar has moved to the top.
Scrolling down displays the conversation in a mobile friendly format:
For most users this should entirely remove the need for the mobile plugin.
Dashboard widgets
We've included many new widget types to help you get started building profile dashboards.
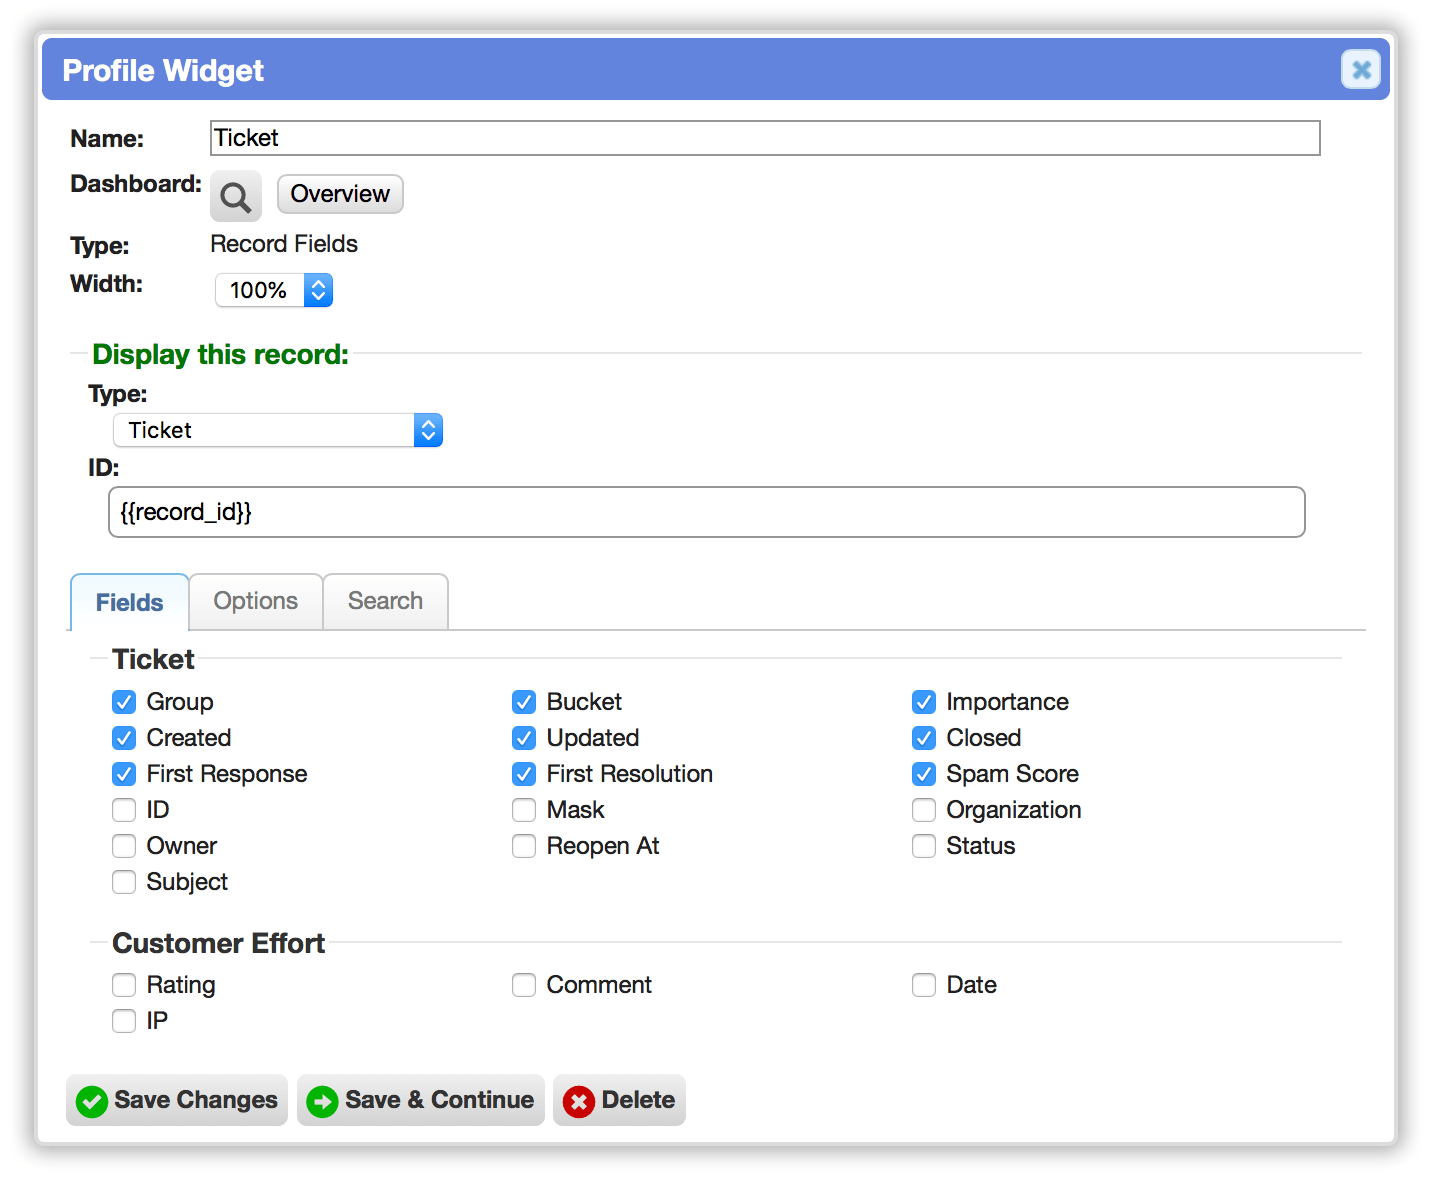
Record Fields
The 'Record Fields' widget displays built-in fields, custom fields, and search buttons for any record. This is like embedding a card summary on your dashboard.
The displayed record can be specified using placeholders. For instance, on a ticket profile, the fields of the ticket and its organization can be displayed at the same time.
The fields and fieldsets to display are configurable. Fields can be dragged into a desired order. This drastically cleans up profiles by only displaying fields that are important and hiding everything else.
A 'Show record links' option determines whether or not to show the 'Links' section for adding links and showing a search button for each type of linked record.
A 'Show empty fields' option determines whether blank fields will be included in the output. This is disabled by default (i.e. fields with no value are hidden).
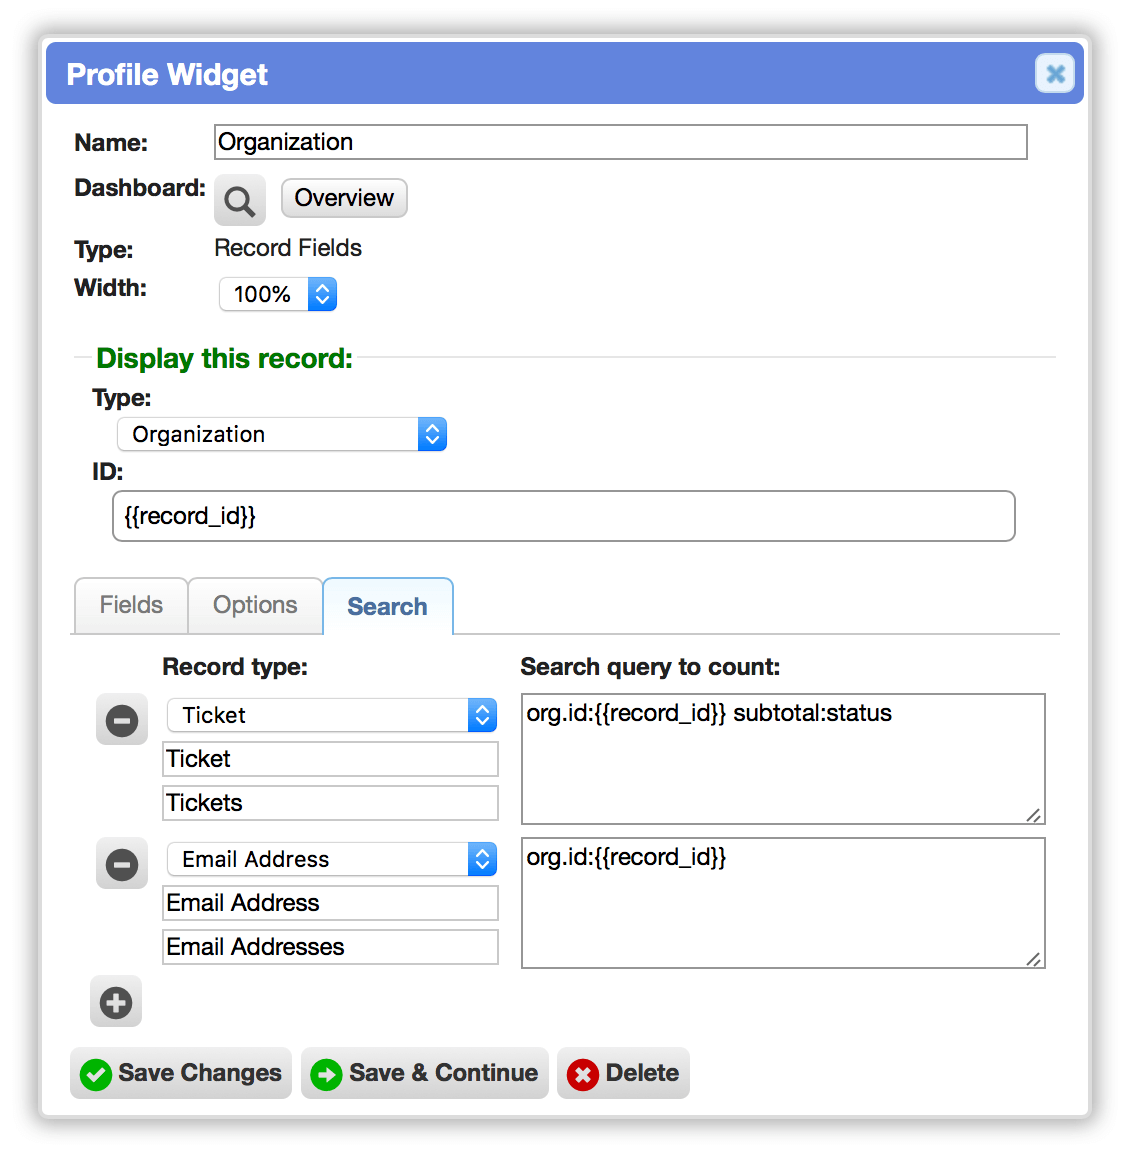
Custom search counter buttons can now be configured for each instance of the widget. These buttons run a search query using placeholders from the target record and return the number of results. For instance, a different set of search counters could be displayed on an organization fields widget on tickets and on contacts. For tickets, counts of the organization's ticket history and contacts could be shown.
This widget replaces the properties area at the top of profiles, moving the tabs right to the top without requiring scrolling.
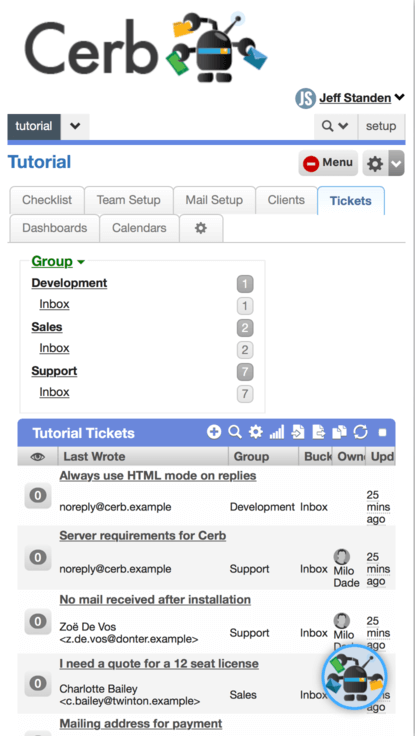
Worklists
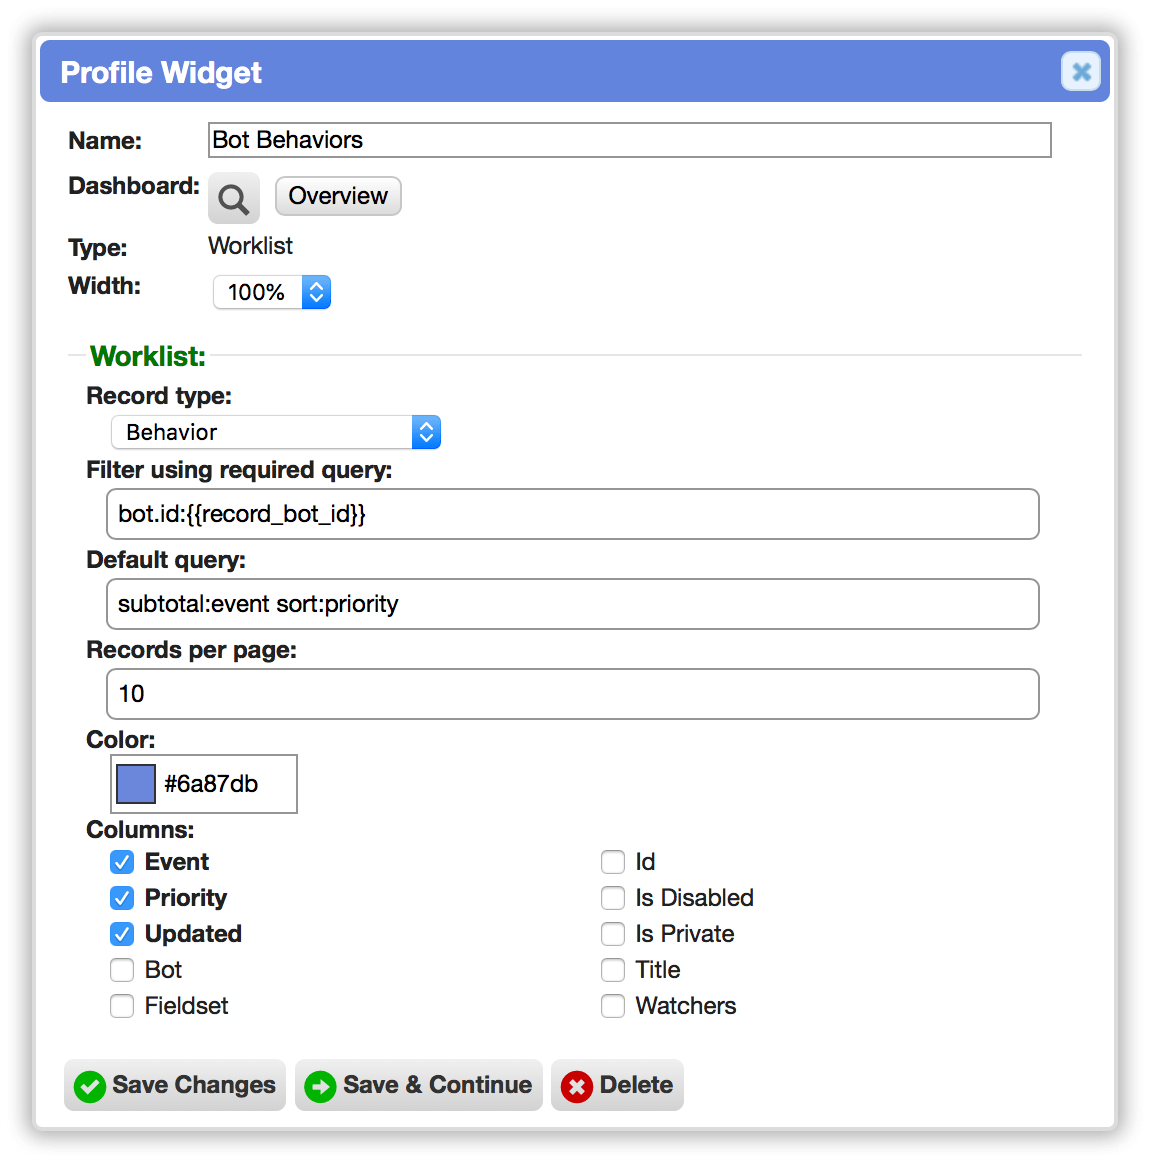
Unlike worklists on older workspace dashboards, worklist widgets on profiles offer full functionality. This allows worklists and other visualizations to be mixed on the same dashboard.
Worklist widgets have a simplified configuration: record type, required query, default query, records per page, color, and columns.
Worker-level changes (filtering, sorting, paging) are persisted per-record for the duration of the session.
Project Boards
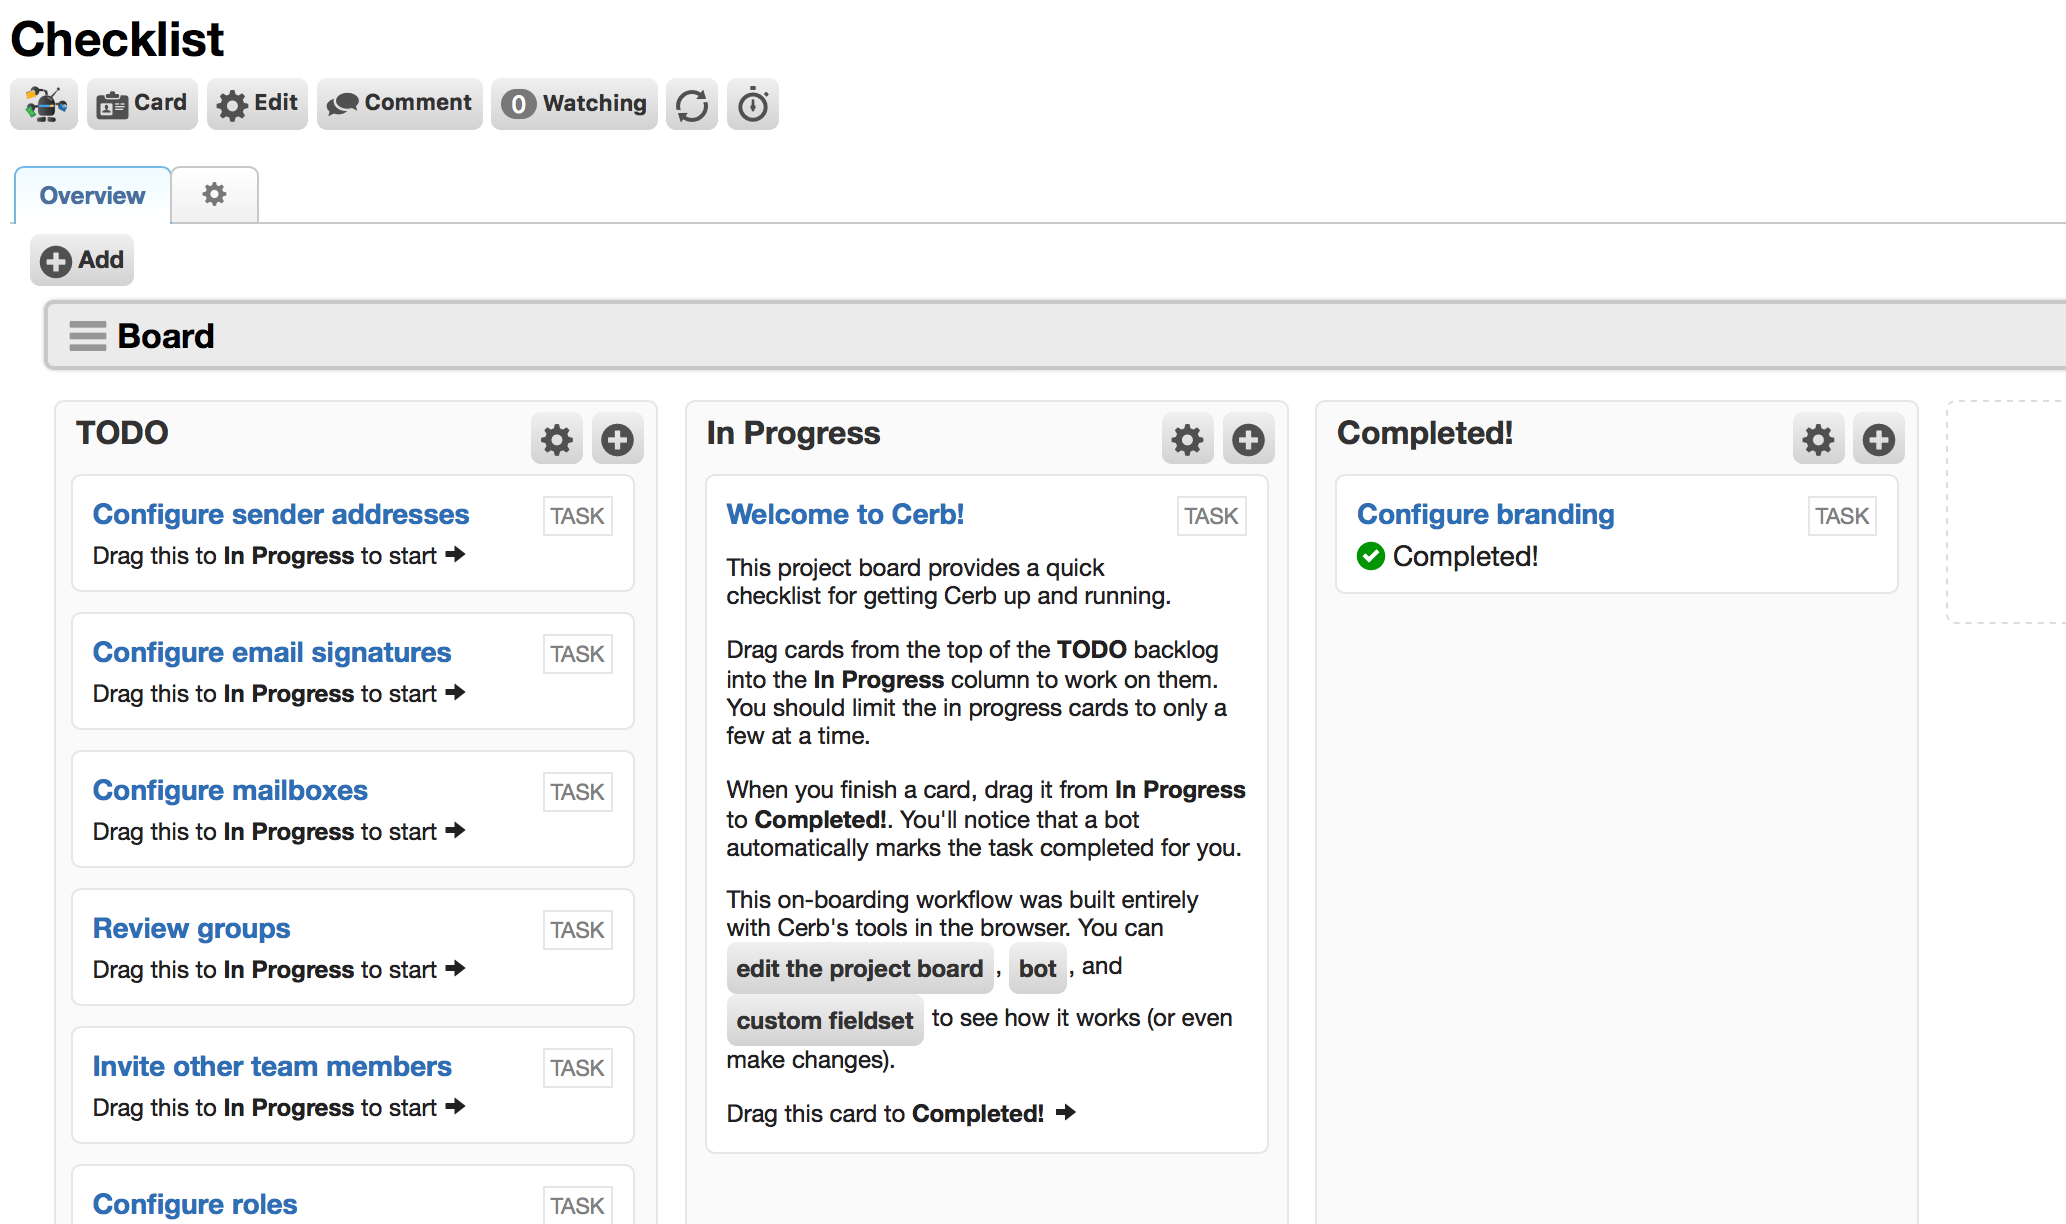
Added a 'Project Board' widget to profile dashboards. This displays any project board and is configurable with placeholders.
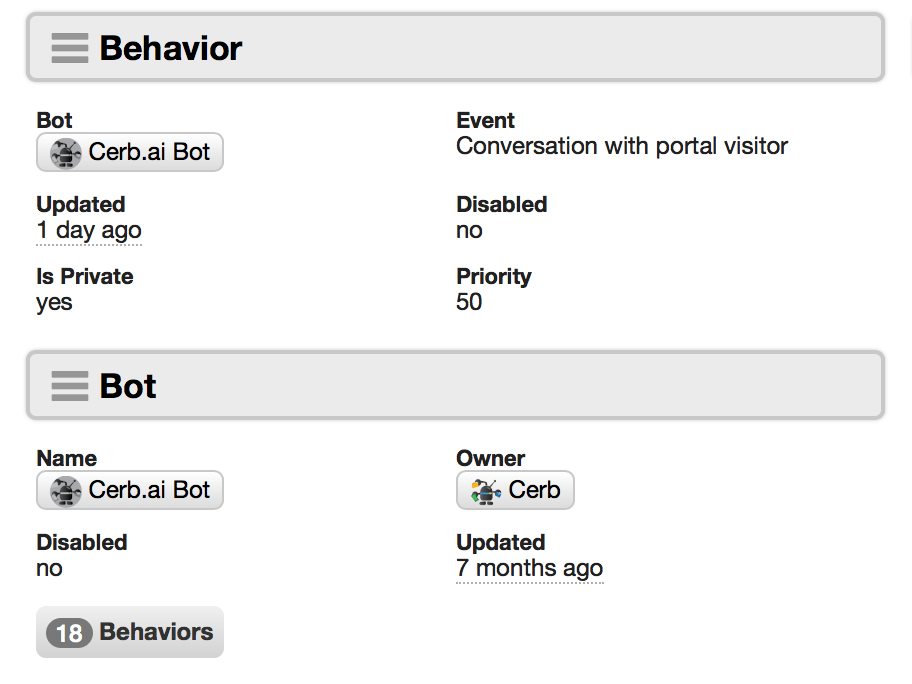
Behavior Tree
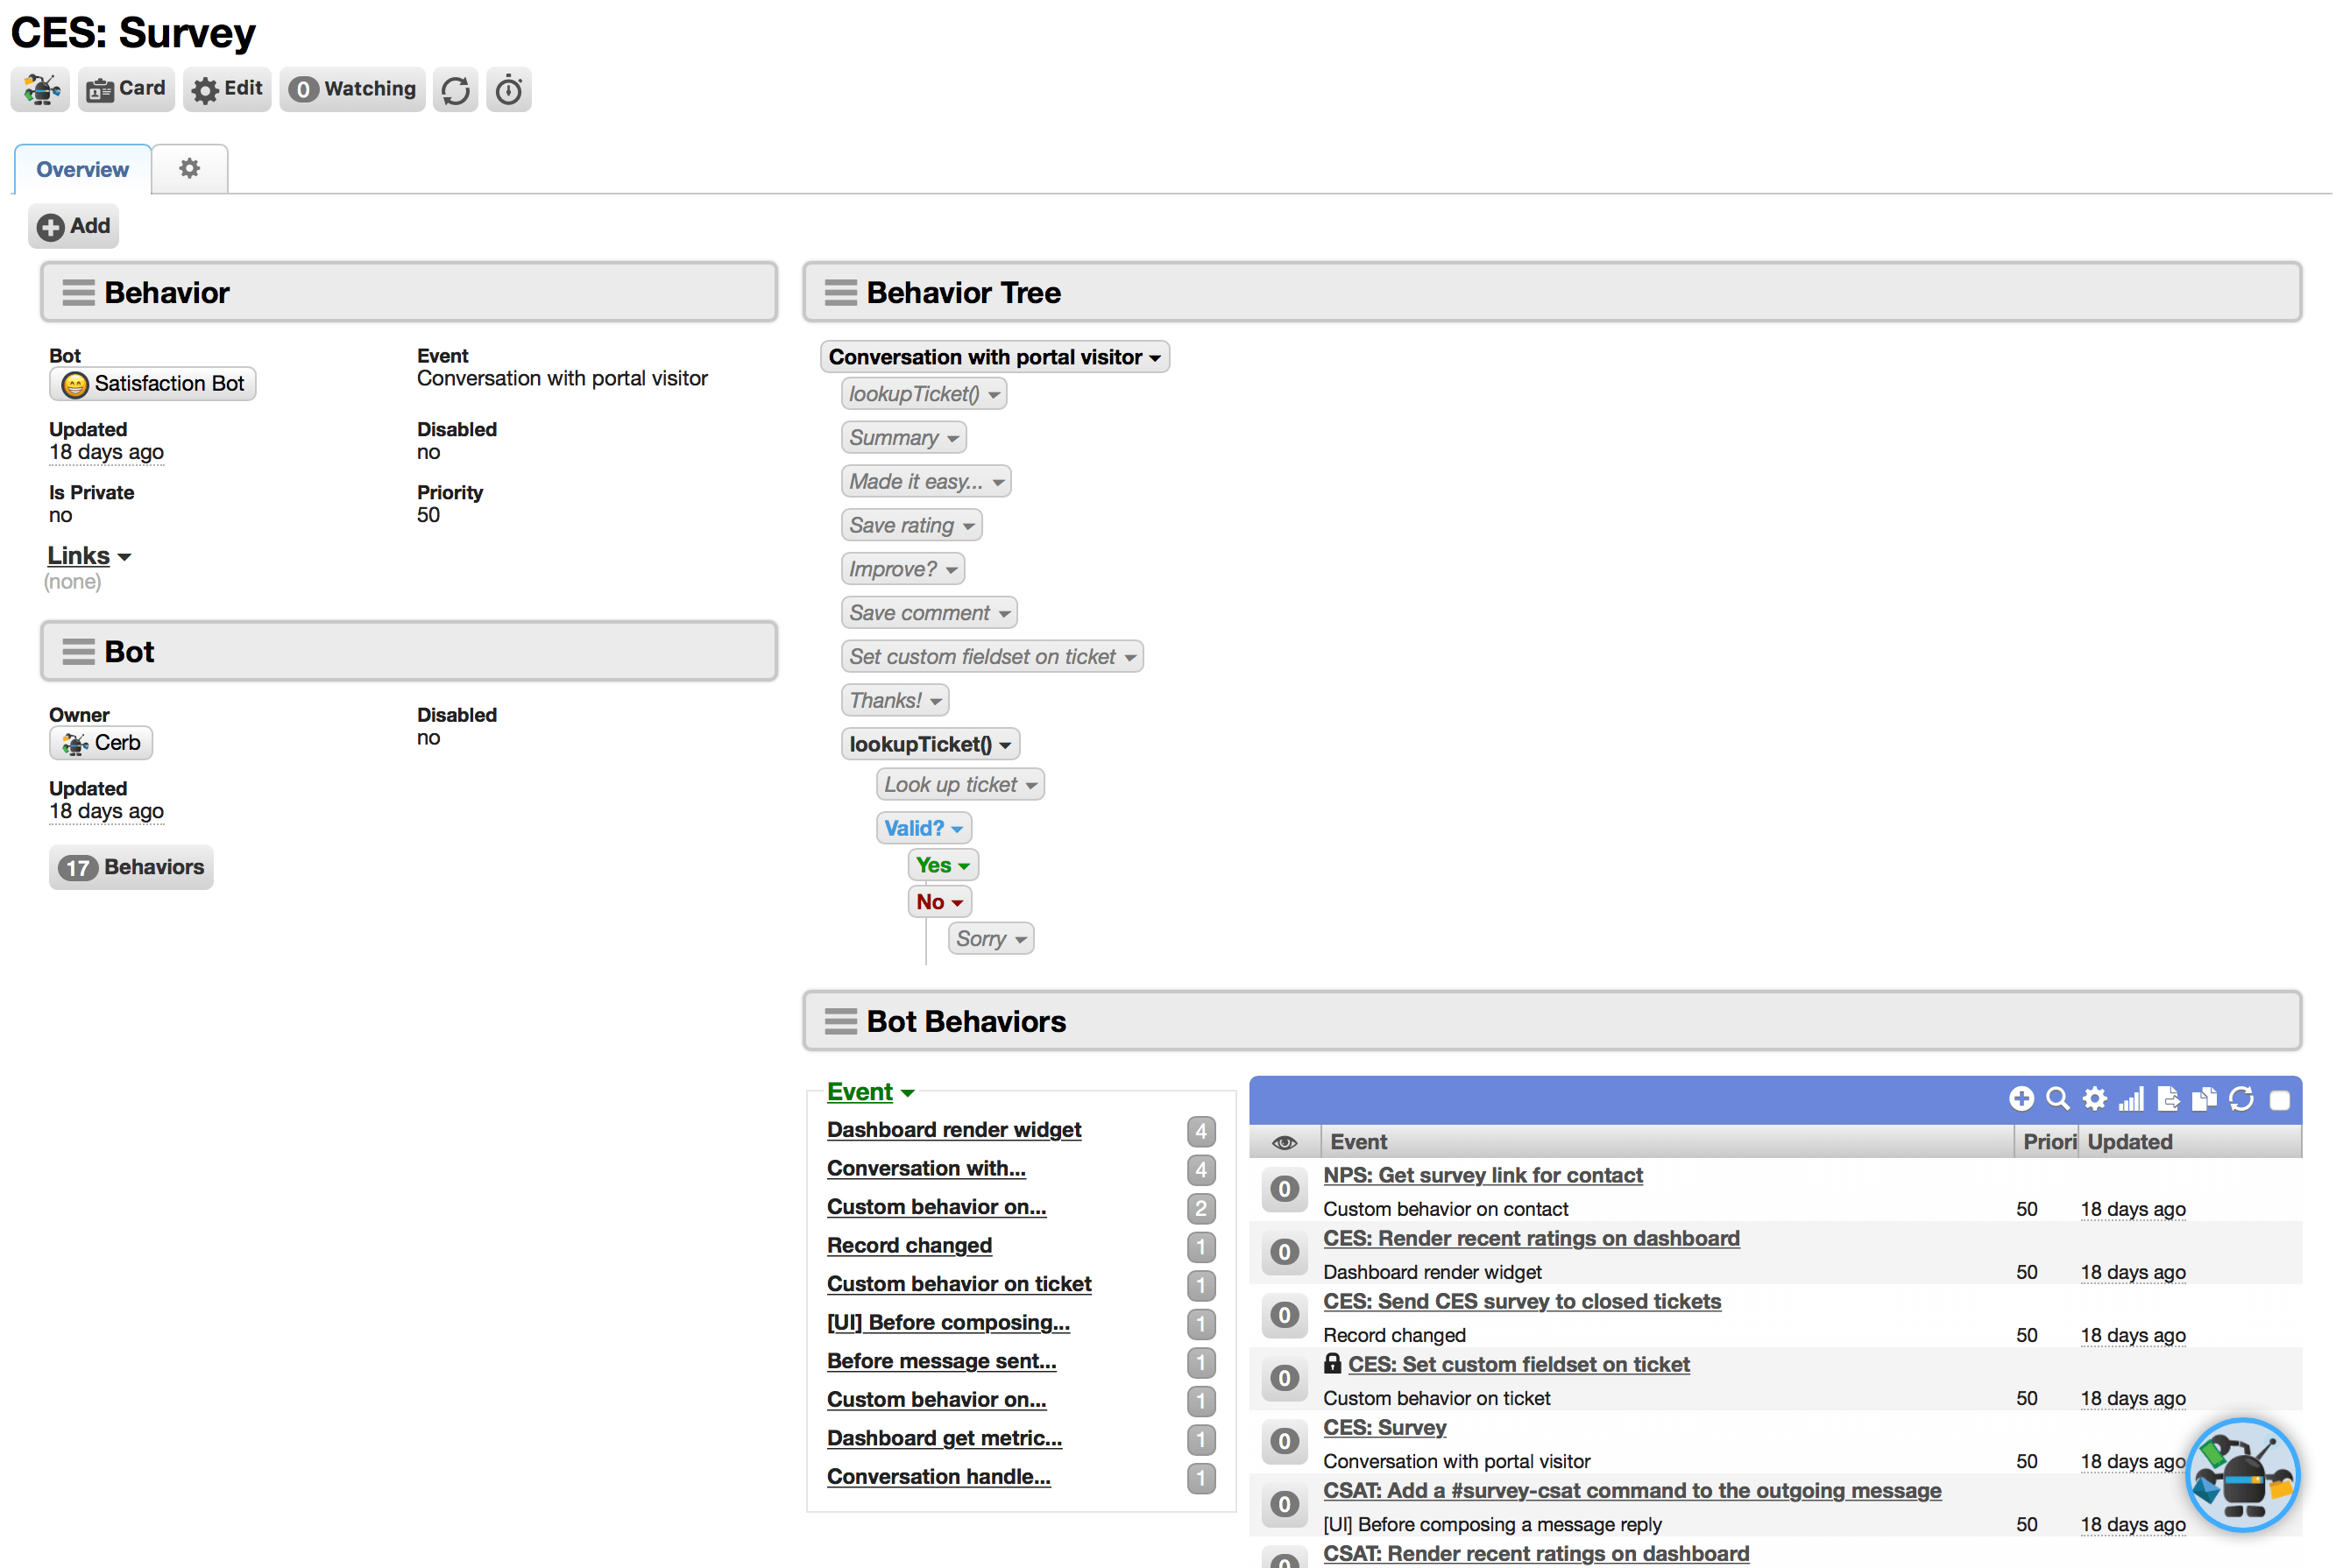
Added a 'Behavior Tree' widget to profile dashboards. This can display the editable decision tree for any bot behavior. It's configurable using placeholders.
Calendar
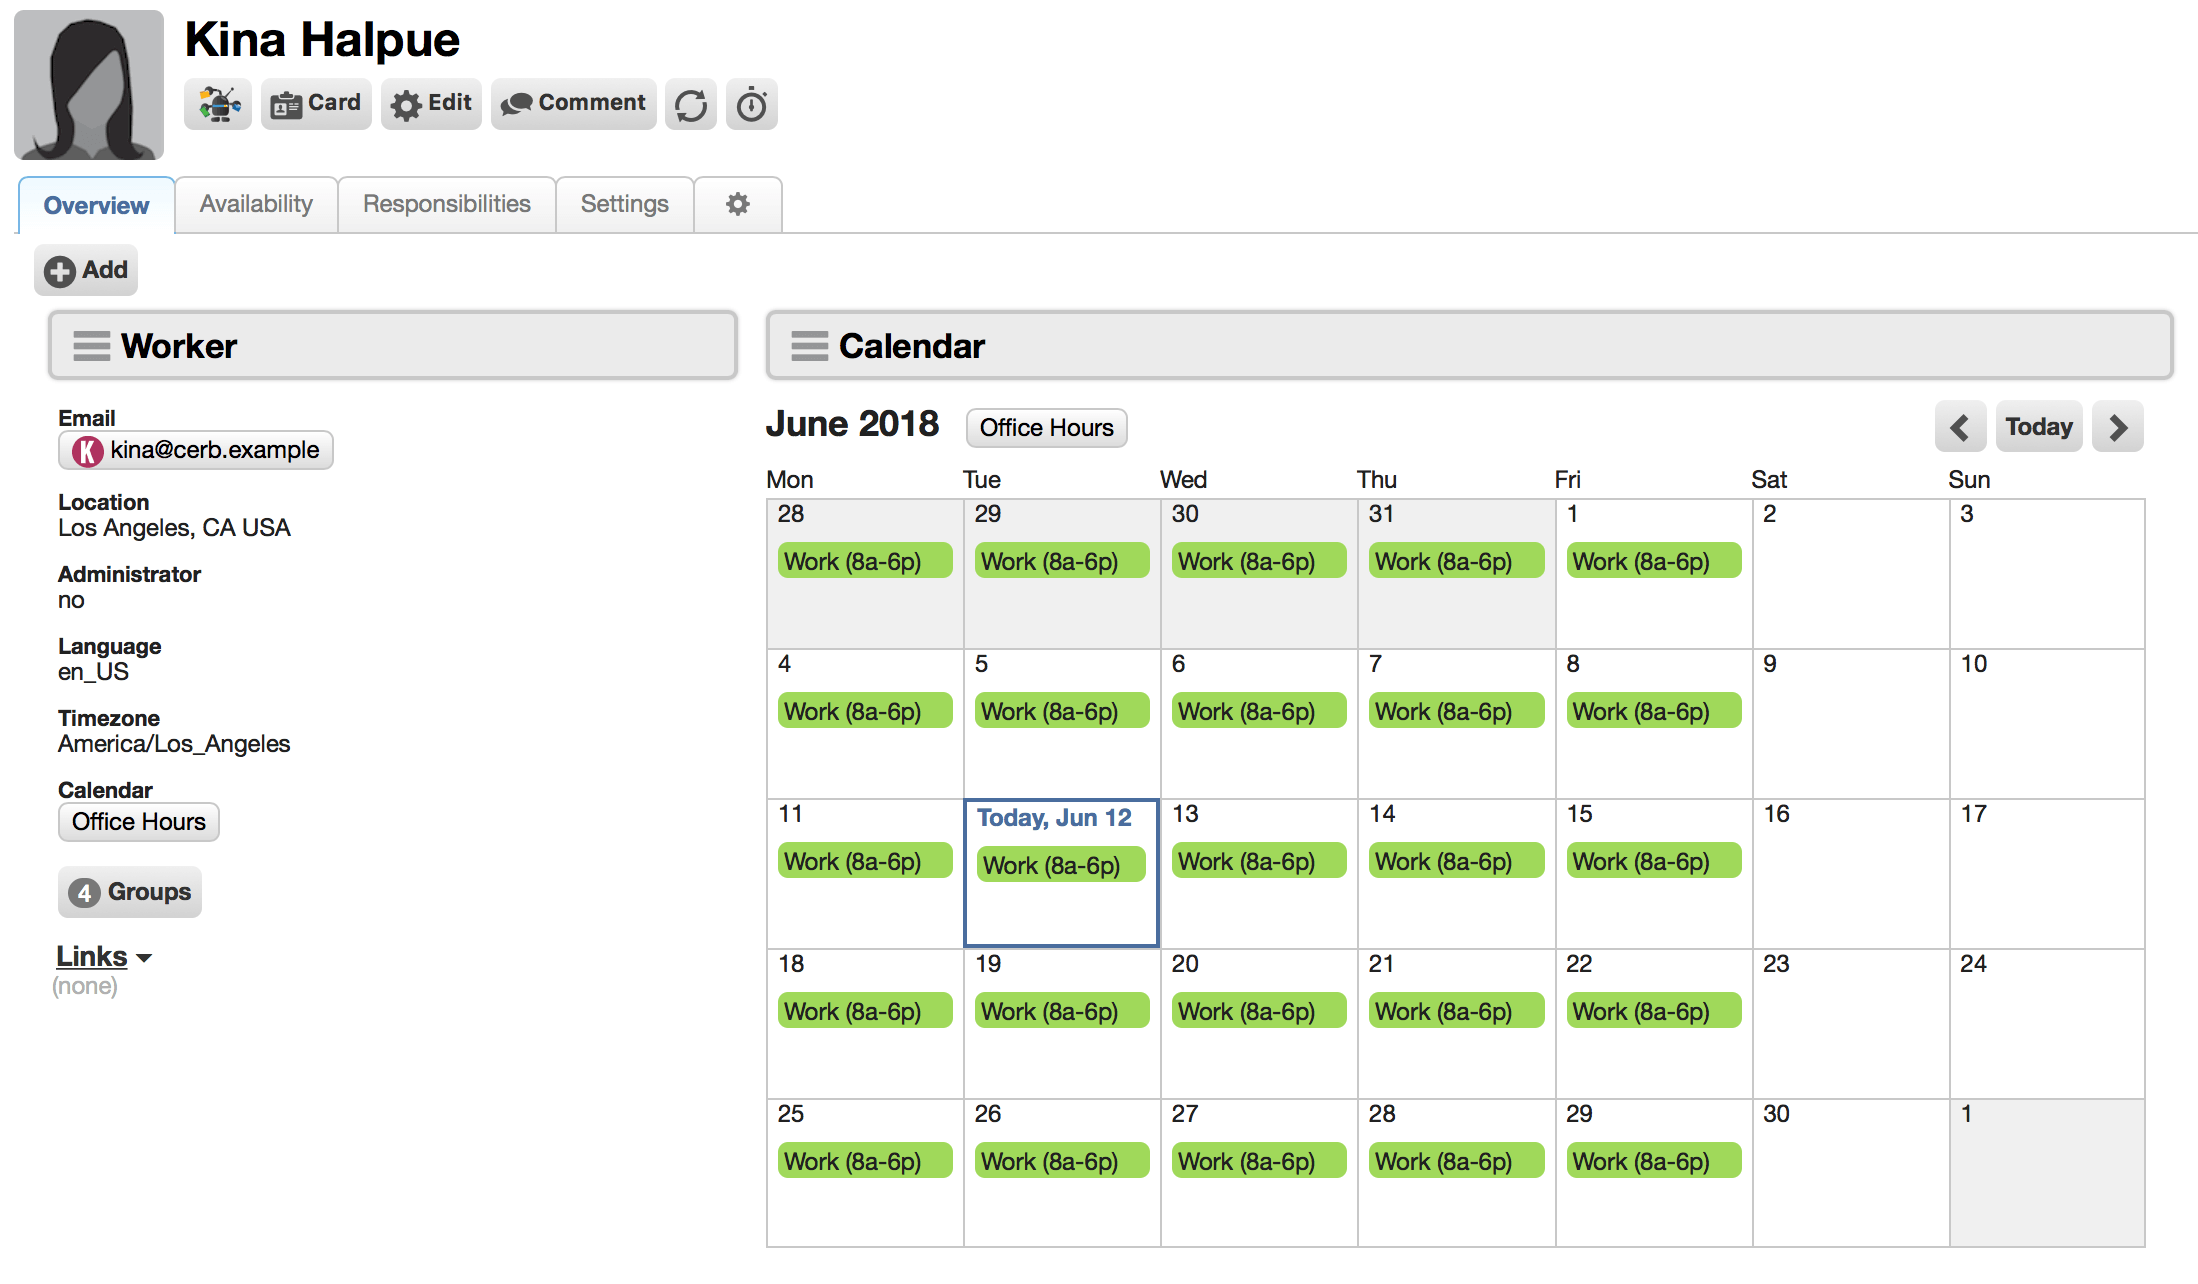
Added a 'Calendar' widget to profile dashboards.
Calendar Availability
Added a 'Calendar Availability' widget to profile dashboards.
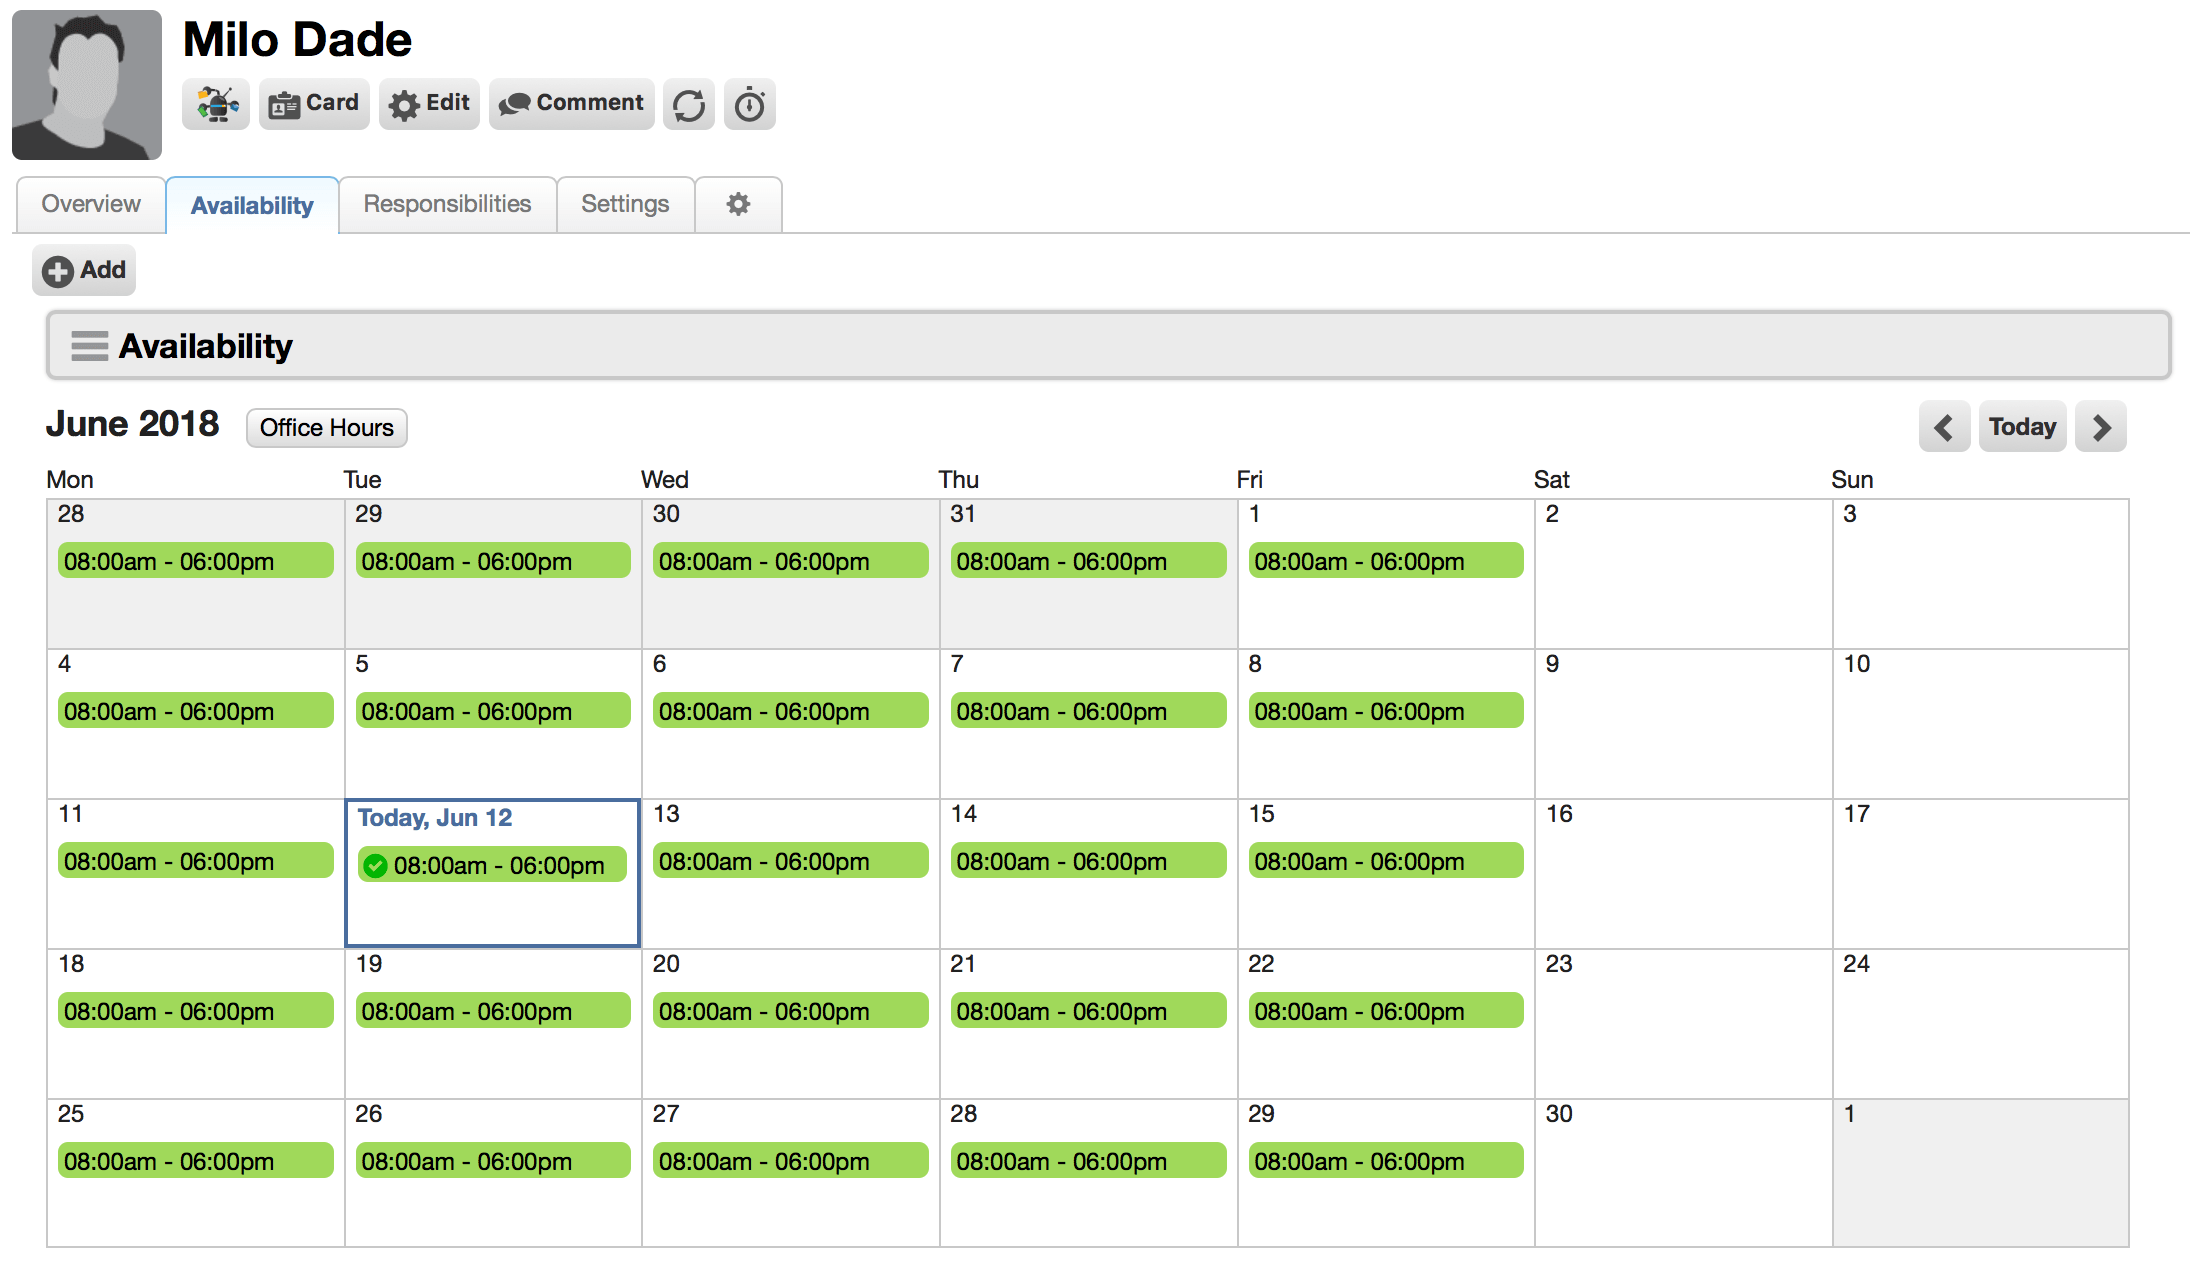
Chart: Categories
Added 'Chart: Categories' widgets to profile dashboards. This uses a data query to build bar or stacked bar charts (depending on whether multiple series are present in the results). This widget draws axis labels and each series can be toggled on/off. The charts are rotated so that categories have more label space along the left side, with quantitative values on the bottom.
The x and y axis labels can be formatted (e.g. text, number, seconds elapsed).
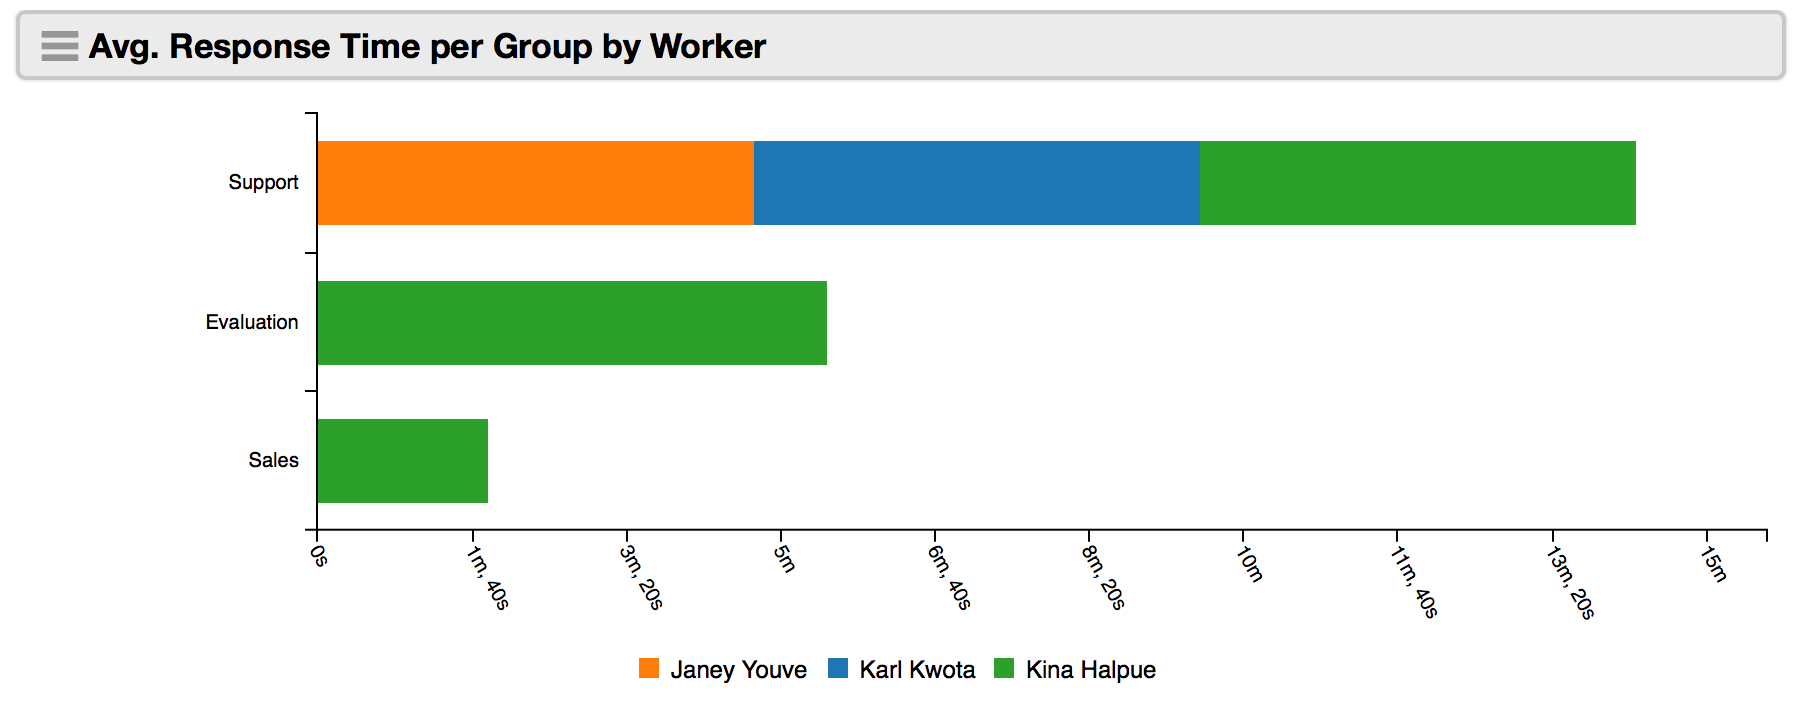
Chart: Pie
Added 'Chart: Pie' widgets to profile dashboards. These use a data query as input and display either a pie or donut chart.
type:worklist.subtotals
of:tickets
by:[status]
query:(group.id:{{record_id}})
format:pie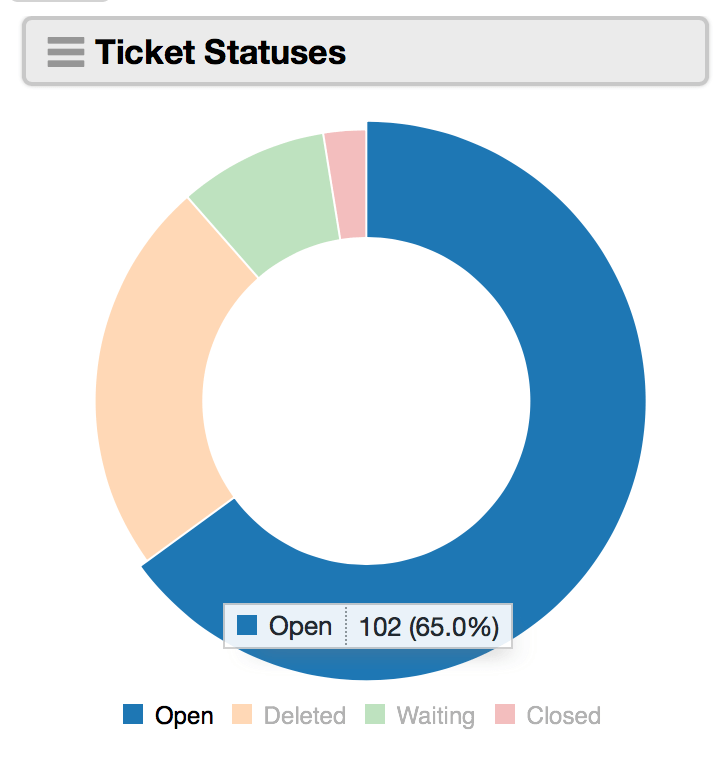
Chart: Scatterplot
Added 'Chart: Scatterplot' widgets to profile dashboards. These plot two dimensional data to visualize clusters or correlations. The input is a data query (including bot behaviors). The axis values can be formatted as numbers or time elapsed.
type:worklist.xy
series.group:(
	label:"ID vs. Spam Score"
	of:tickets
	x:id
	y:spam.score
	query:(
		spam.score:>0
		limit:100
	)
)
format:scatterplot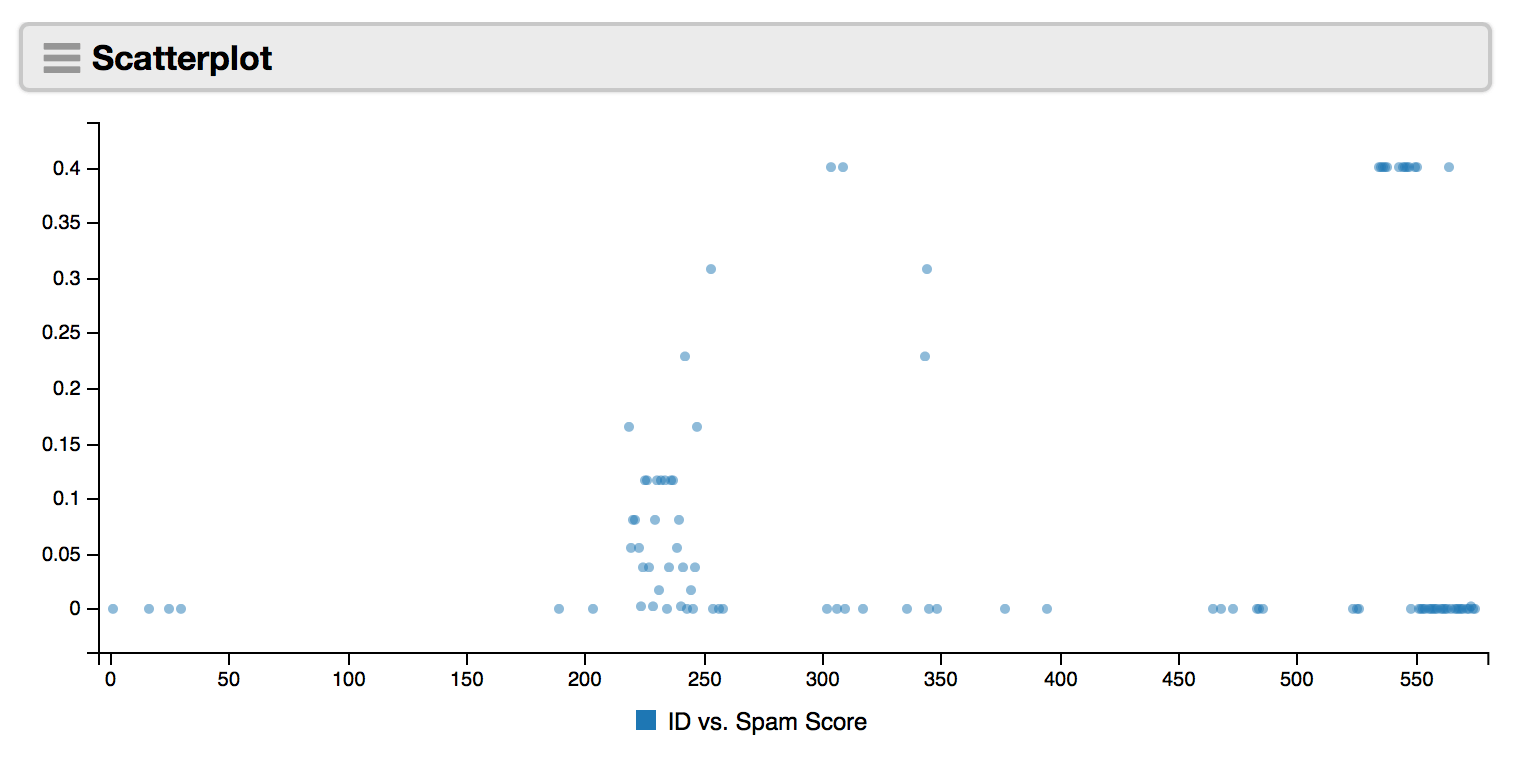
Chart: Table
Added 'Chart: Table' widgets to profile dashboards. These display tabular data as columns and rows. The input is a data query. Many data query sources (e.g. worklist.subtotals) can accept format:table. Columns provide a name, label, and data type for their contents. Each row provides a set of keys and values. By default, column cells display the matching key for each row.
type:worklist.subtotals
of:messages
by:[worker,responseTime]
function:average
query:(
	ticket:(
		group.id:{{record_id}}
	)
)
format:table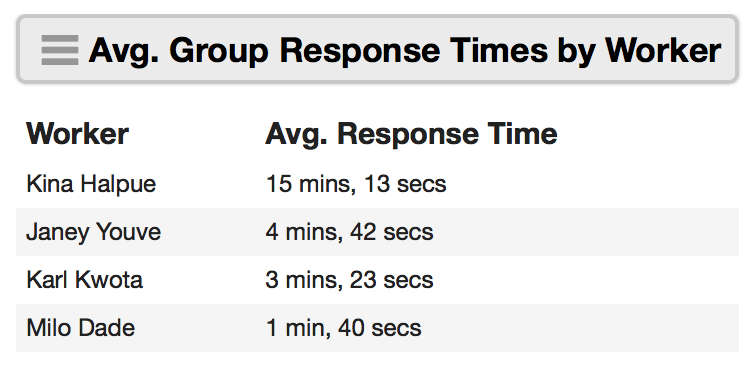
Chart: Time Series
Added 'Chart: Time Series' widgets to profile dashboards. This uses a data query to build time-based charts from worklist or bot-provided data. Multiple series are supported. The data can be displayed as line charts, splines, areas, bars, or stacked bars. A 'timeline brush' can be enabled below the chart for zooming in on selections of the data. Data points can be shown or hidden. The date format of the x-axis labels is also configurable.
The y-axis can be formatted as: number, time elapsed (minutes), or time elapsed (seconds).
type:worklist.subtotals
of:messages
by:[created@month,group]
query:(
	worker.id:{{record_id}}
	isOutgoing:y
	isBroadcast:n
	created:"first day of this month -1 year"
)
format:timeseries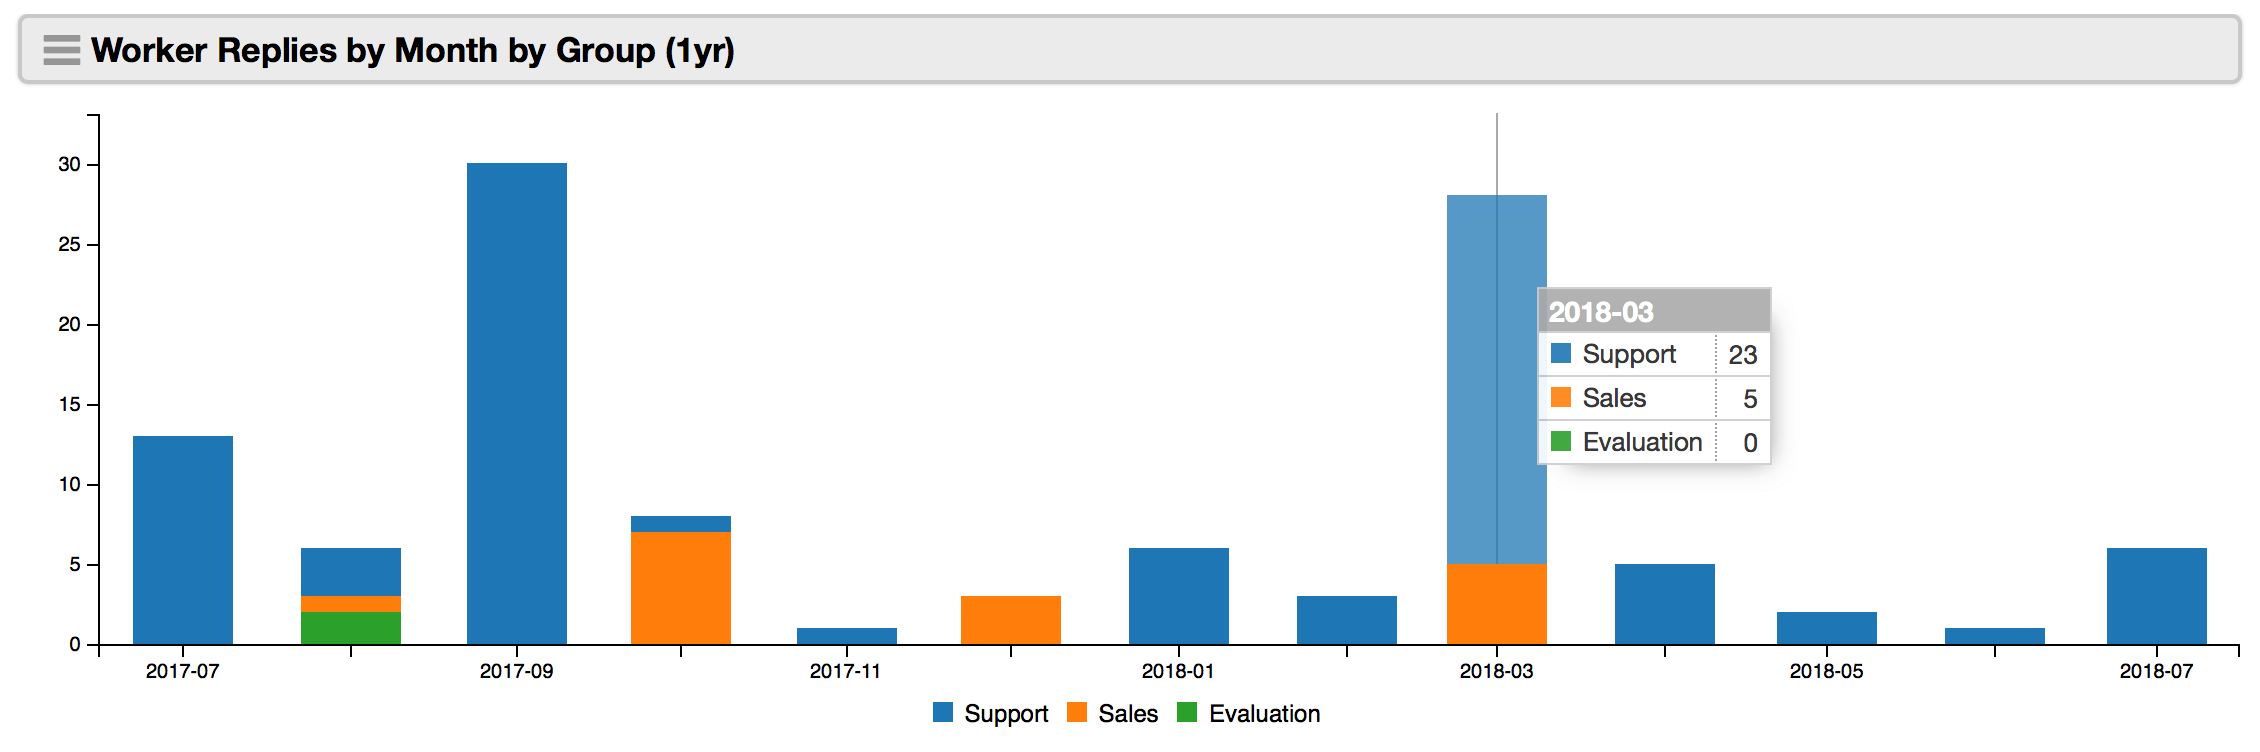
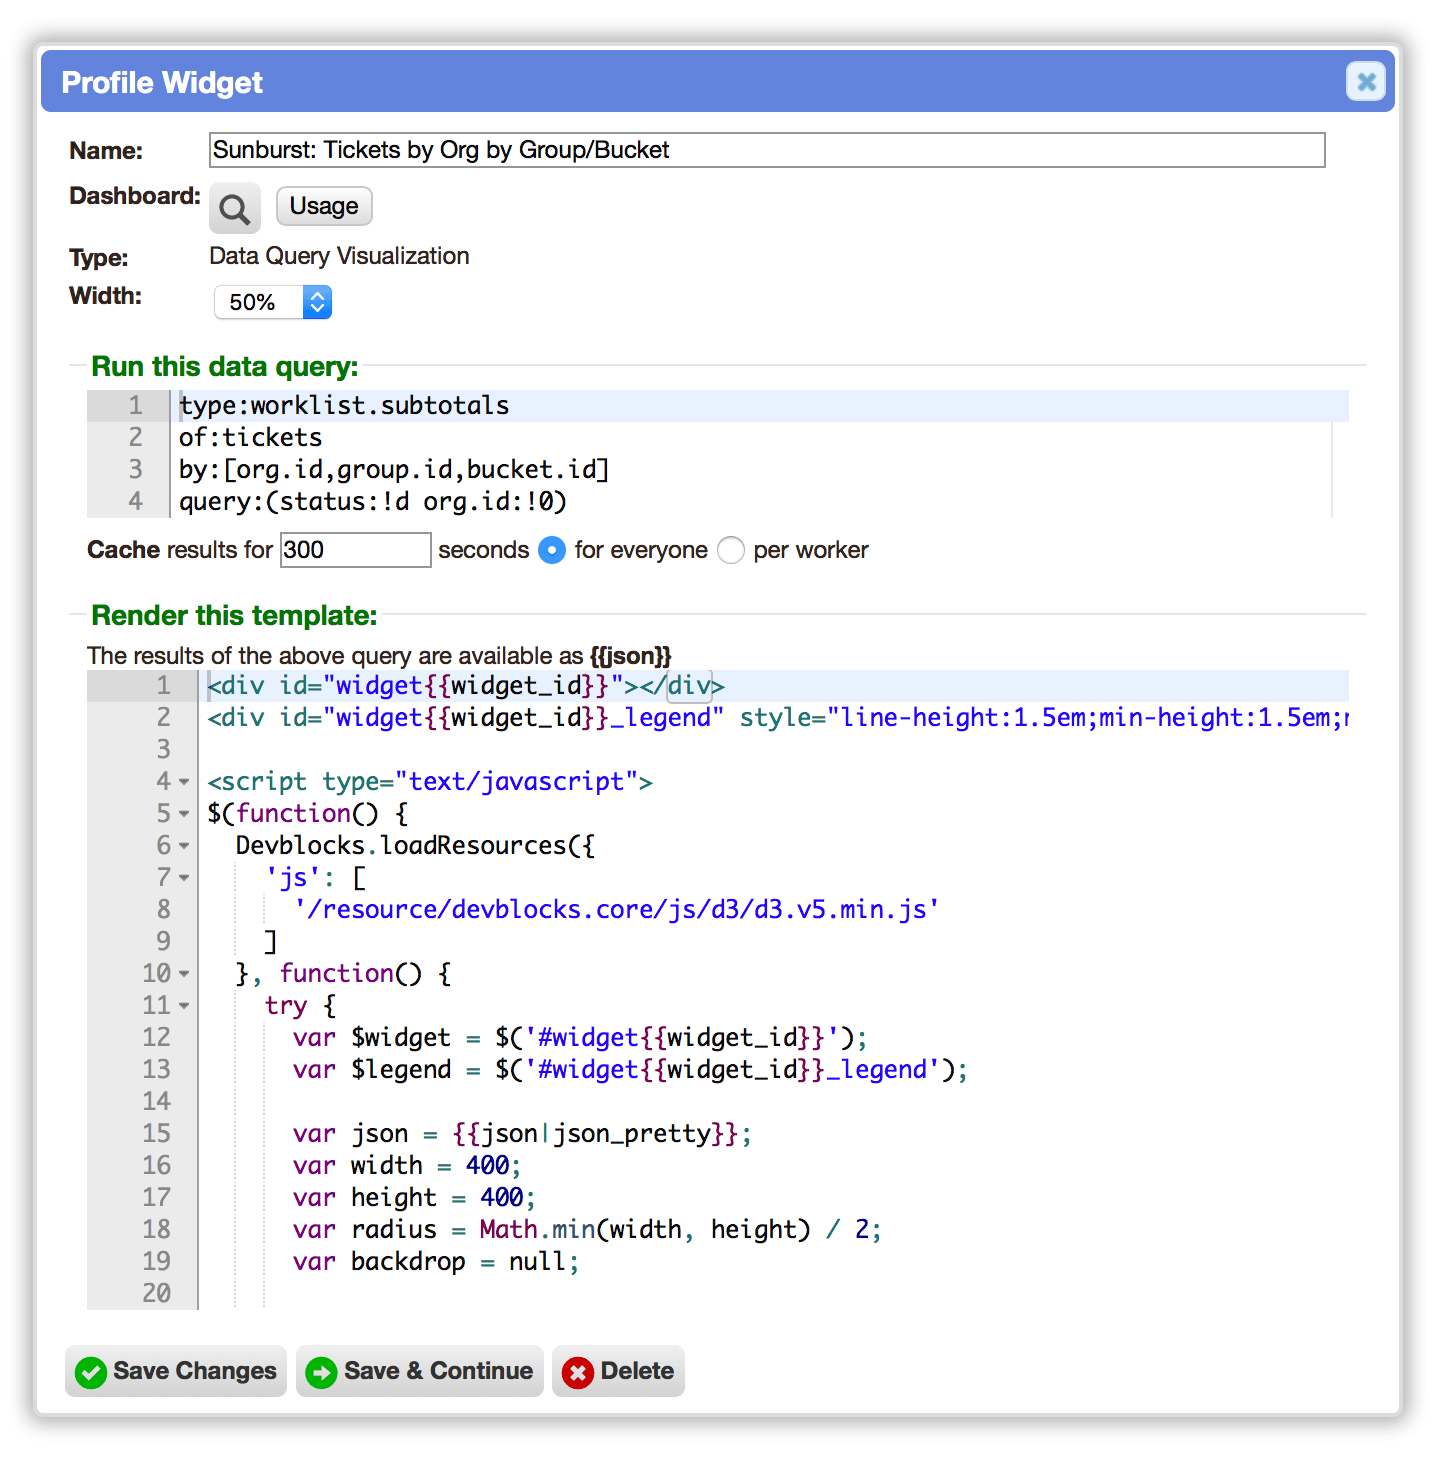
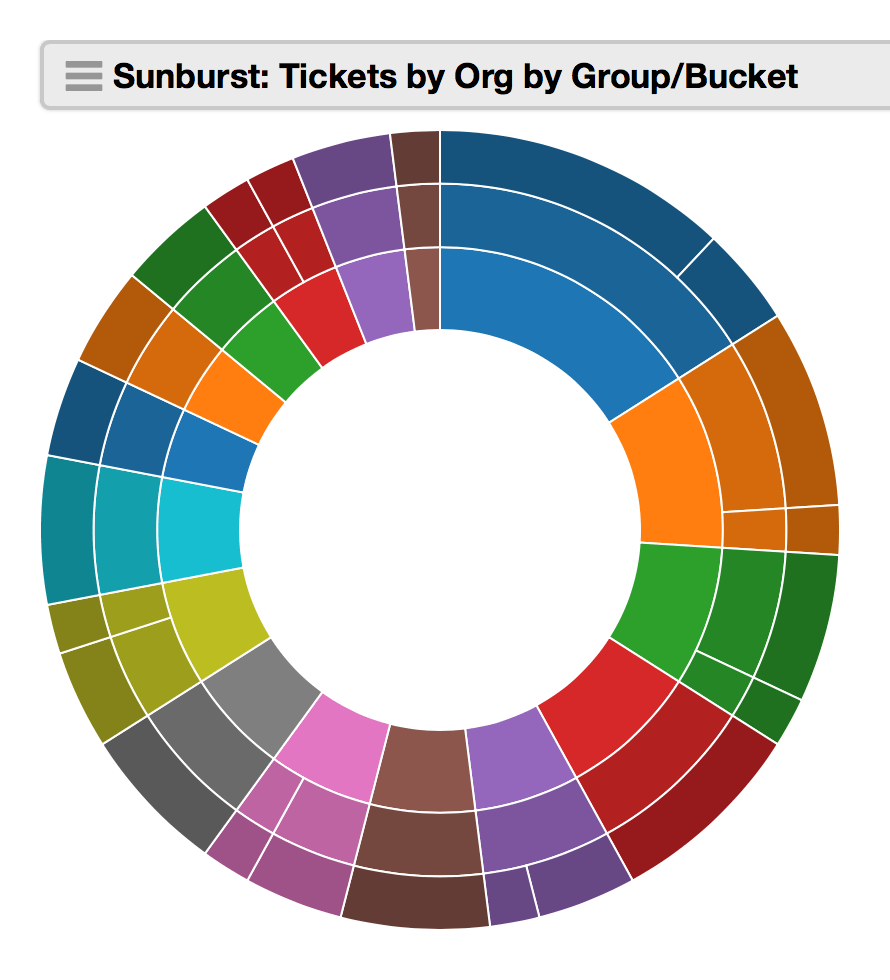
Data Query Visualization
On profile dashboards, a new 'Data Query Visualization' widget is available to administrators. This runs a data query and returns the results as JSON to a custom HTML/Javascript template.
Any Javascript library (including bundled C3.js and D3.js) can be used to create custom charts and visualizations.
This is much simpler than having to create a bot behavior for each custom visualization.
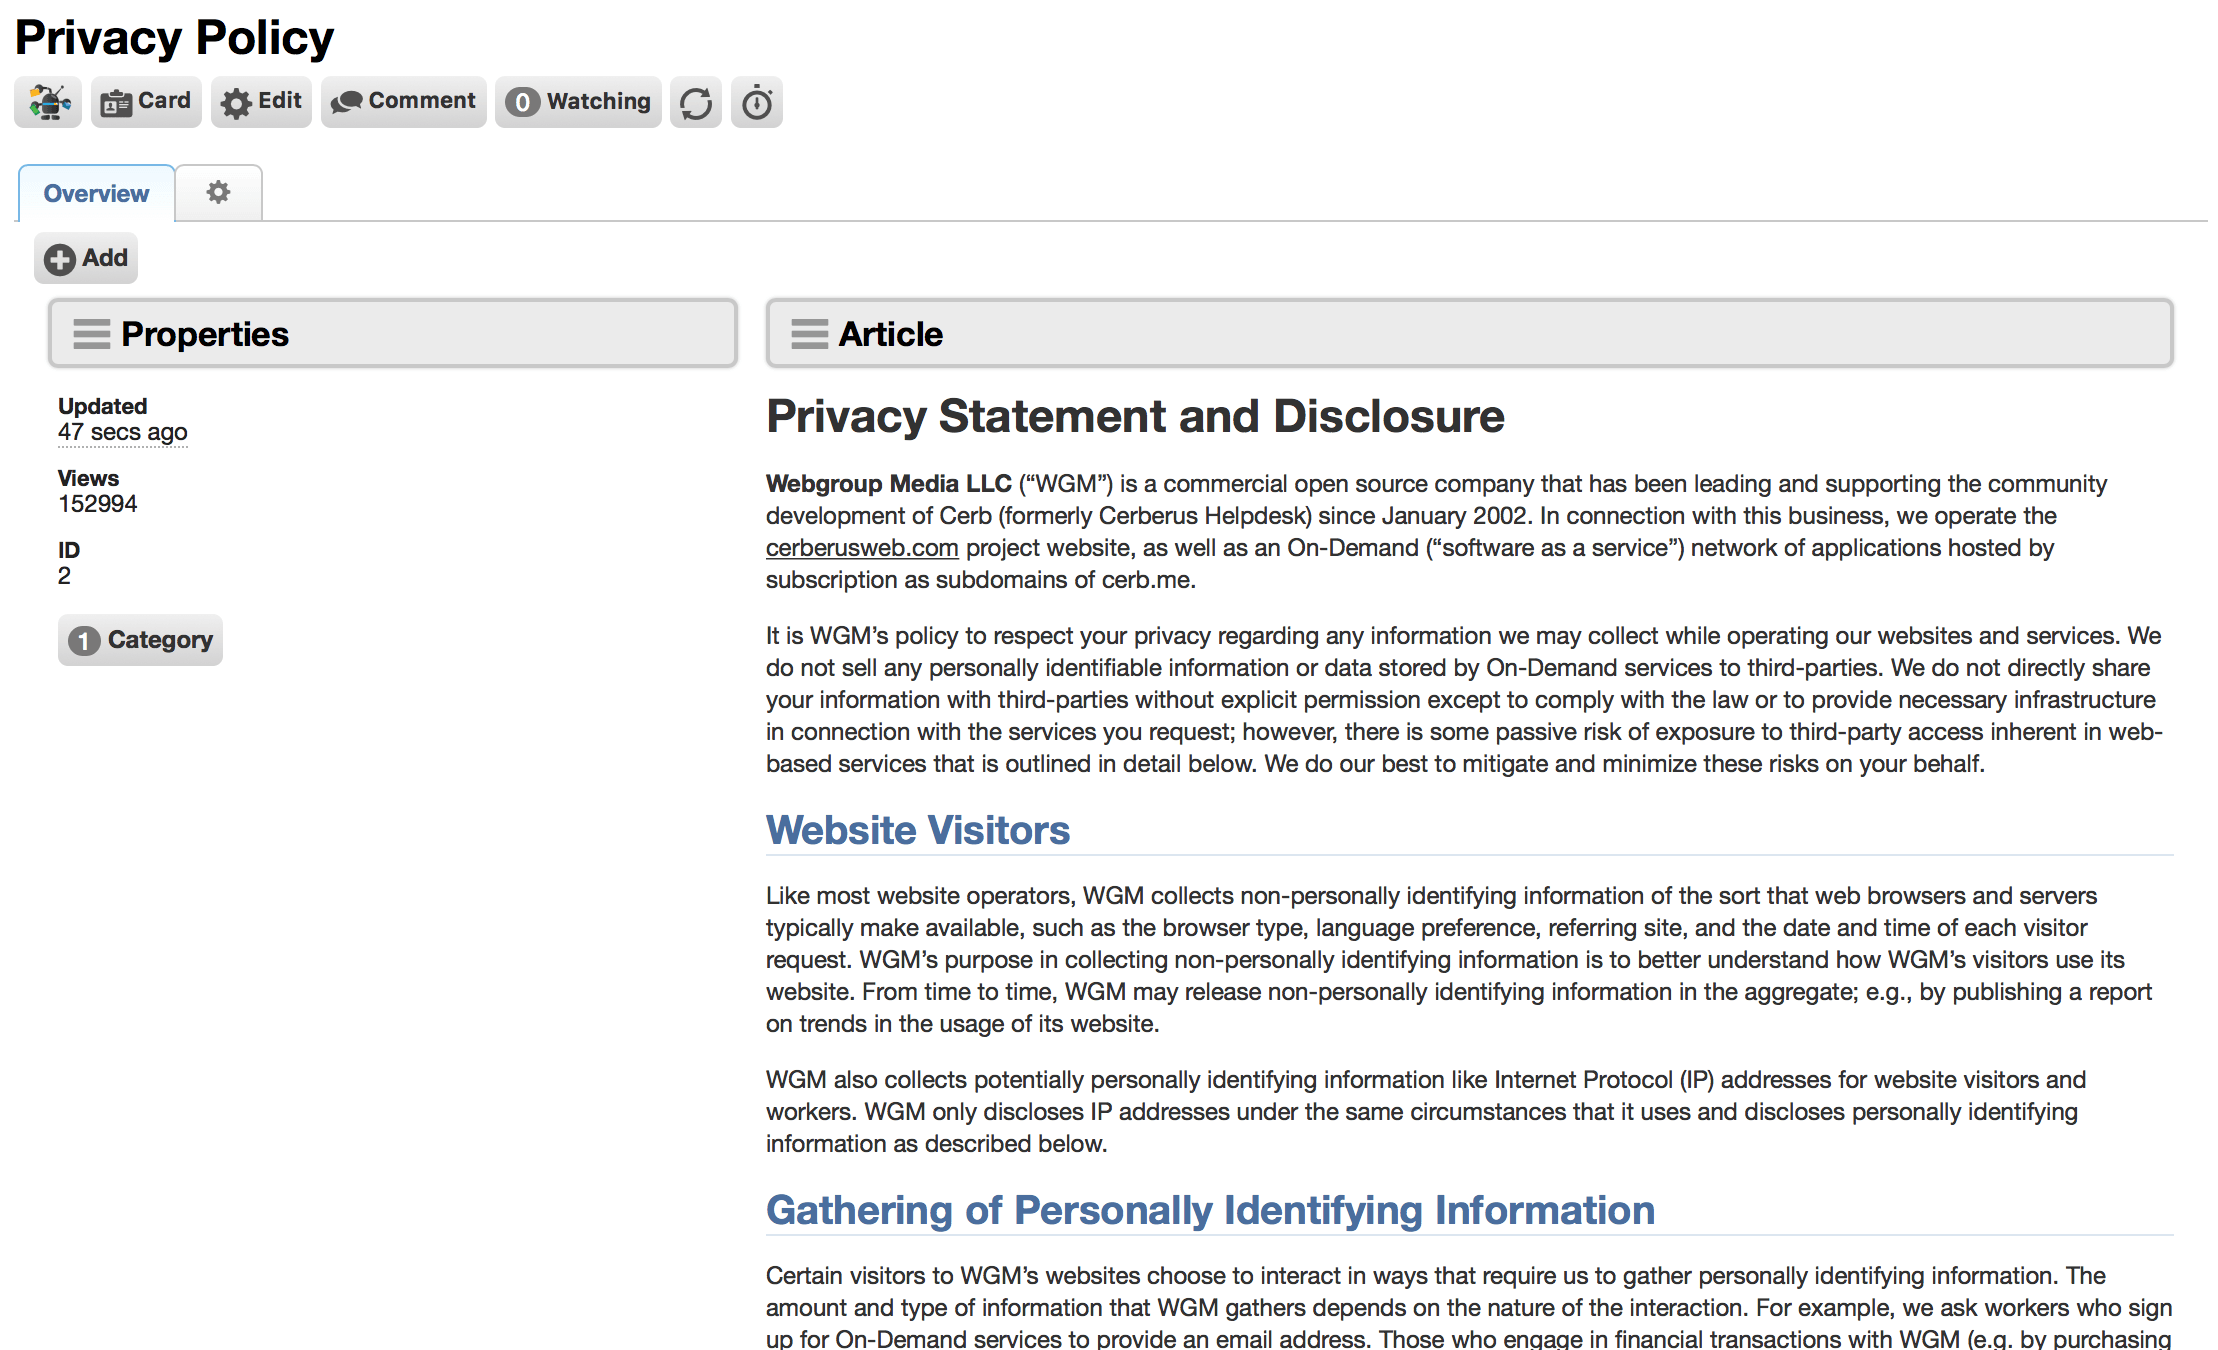
Knowledgebase Article
Added a 'Knowledgebase Article' widget to profile dashboards. This displays any article and is configurable using placeholders.
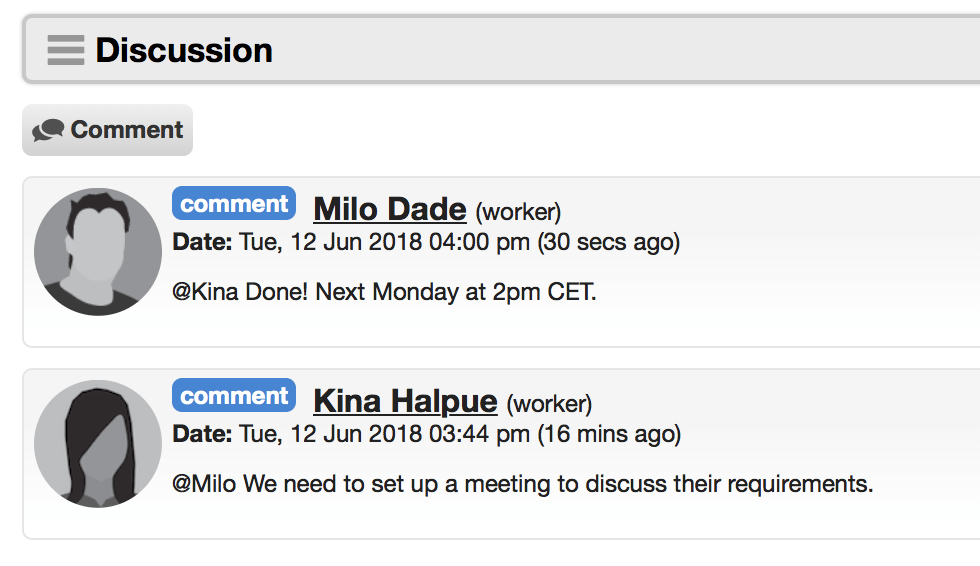
Comments
Added a 'Comments' widget to profile dashboards. This displays the comment discussion thread for a given record. This replaces the previous built-in 'Comments' tab from profiles.
HTML/Javascript
Added an 'HTML/Javascript' widget to profile dashboards. This allows admins to render arbitrary content to the screen using bot scripting and the placeholders of the current record. For instance, data from a (hidden) fieldset can be displayed as a visualization.
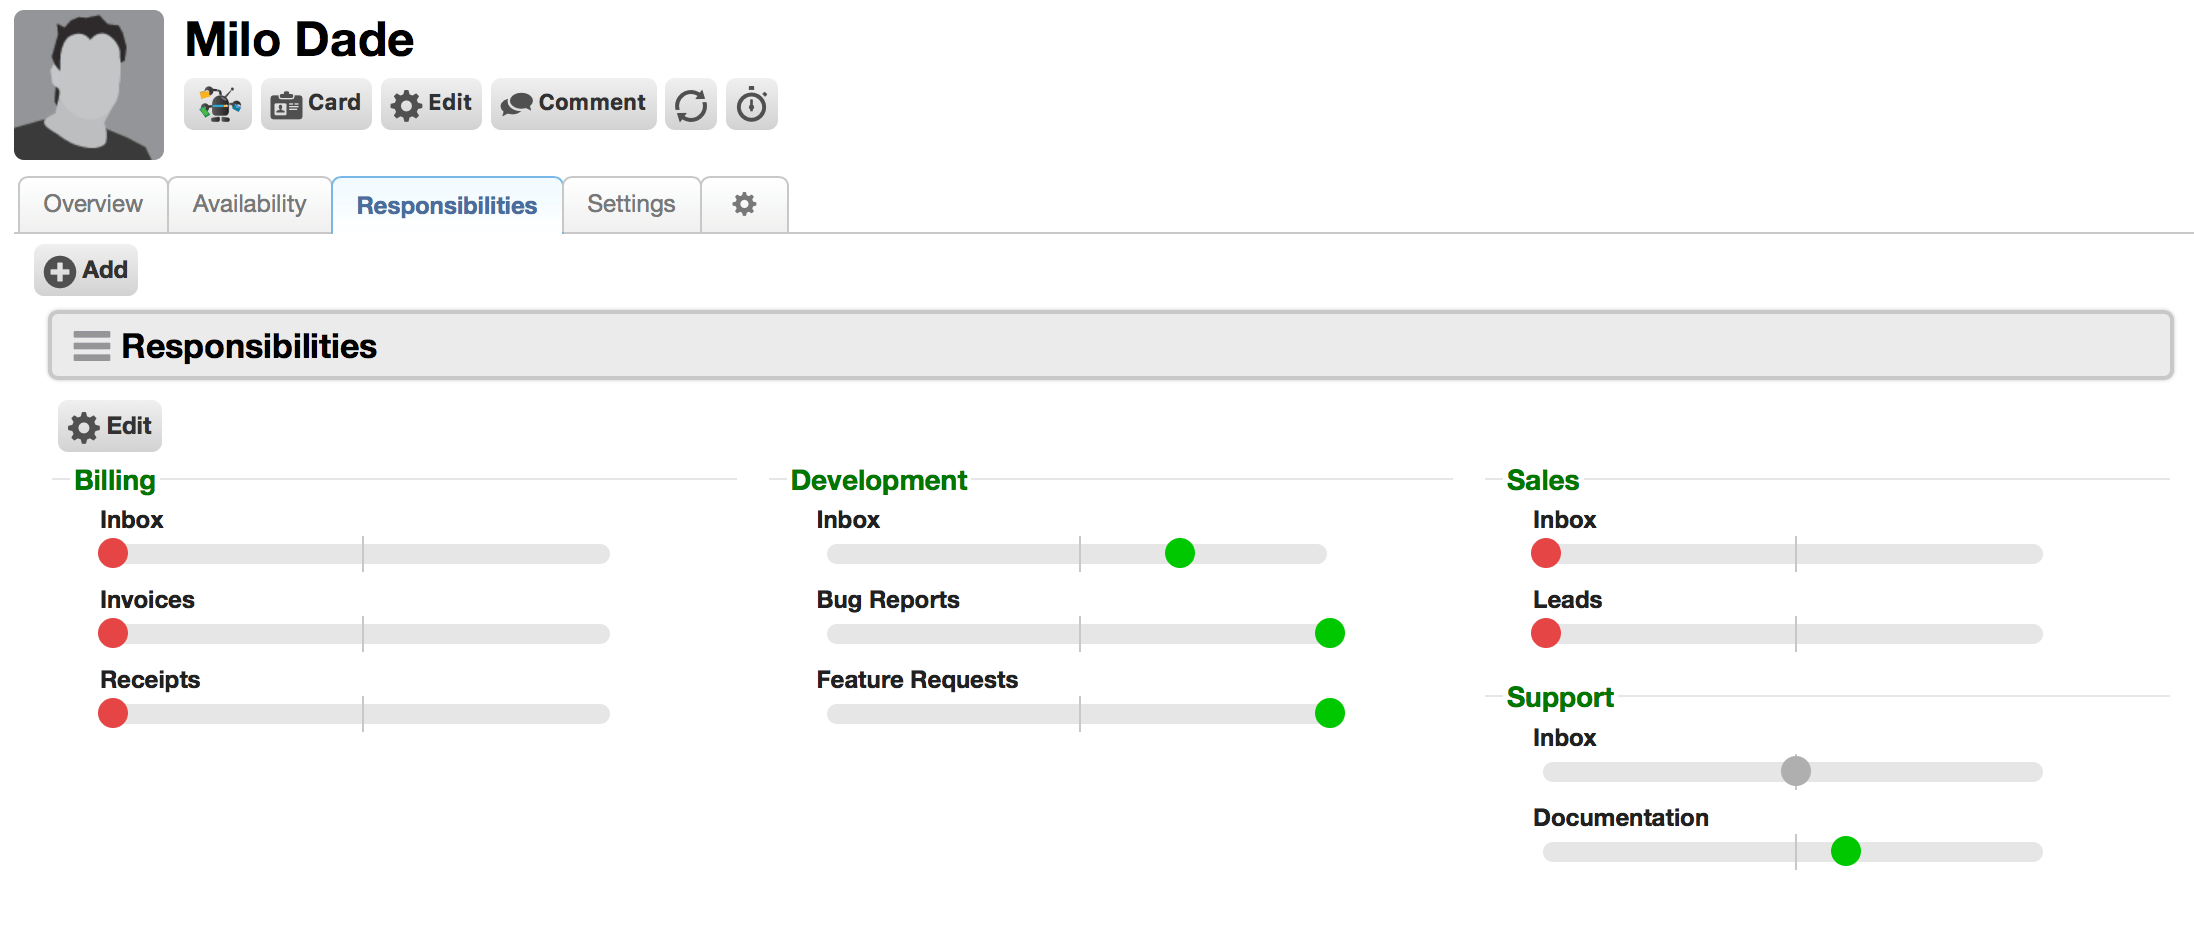
Responsibilities
Added a 'Responsibilities' widget to profile dashboards on worker and group records. This replaces the built-in tab.
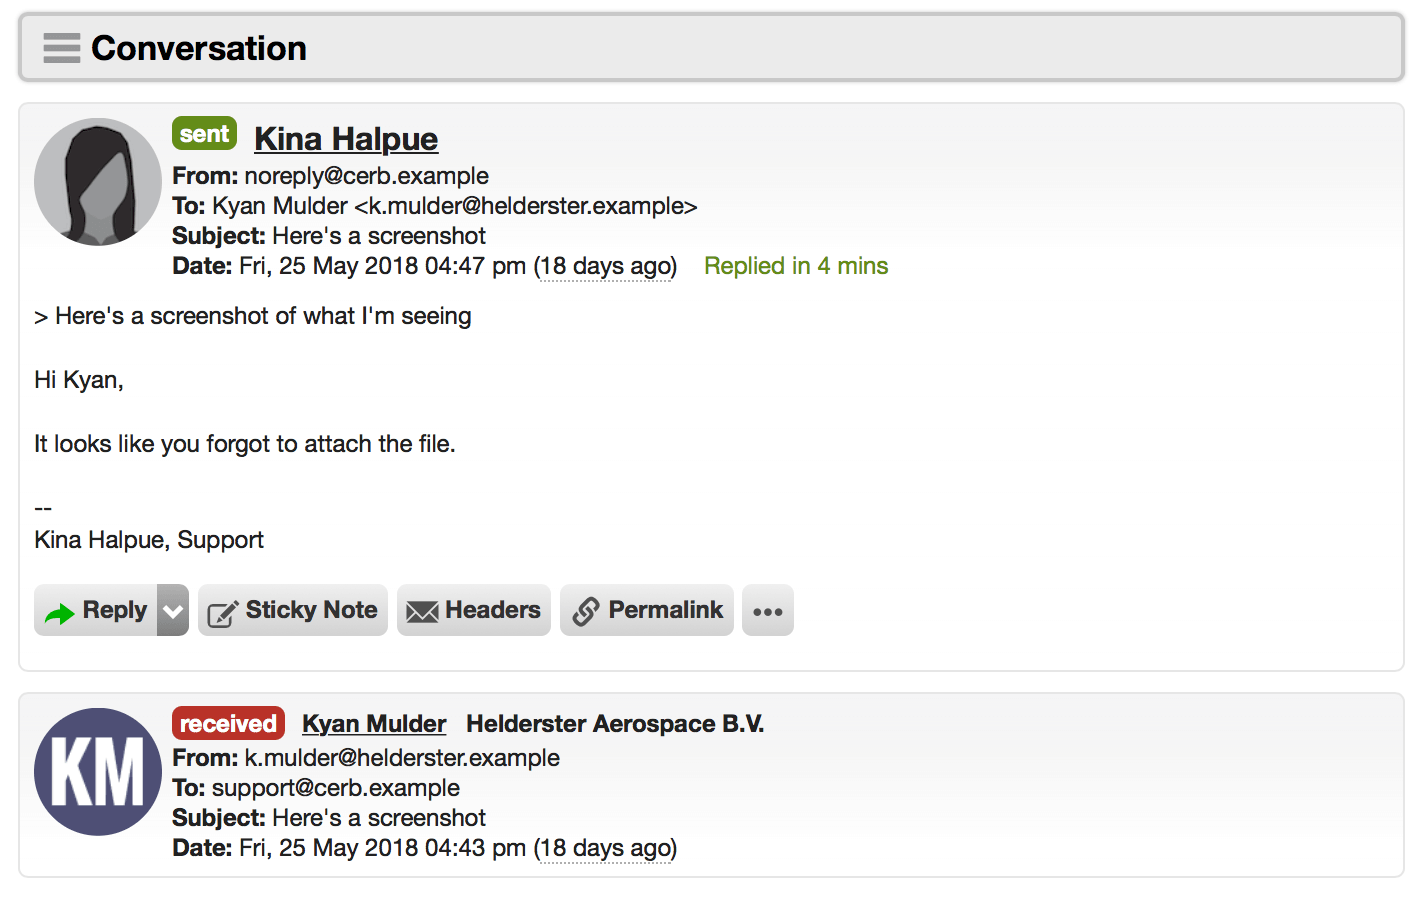
Ticket Conversation
Added a 'Ticket Conversation' widget to profile dashboards. This displays the the ticket timeline with messages and comments, allows replying, etc. As a widget, this can be moved around to a desired location on the ticket profile page.
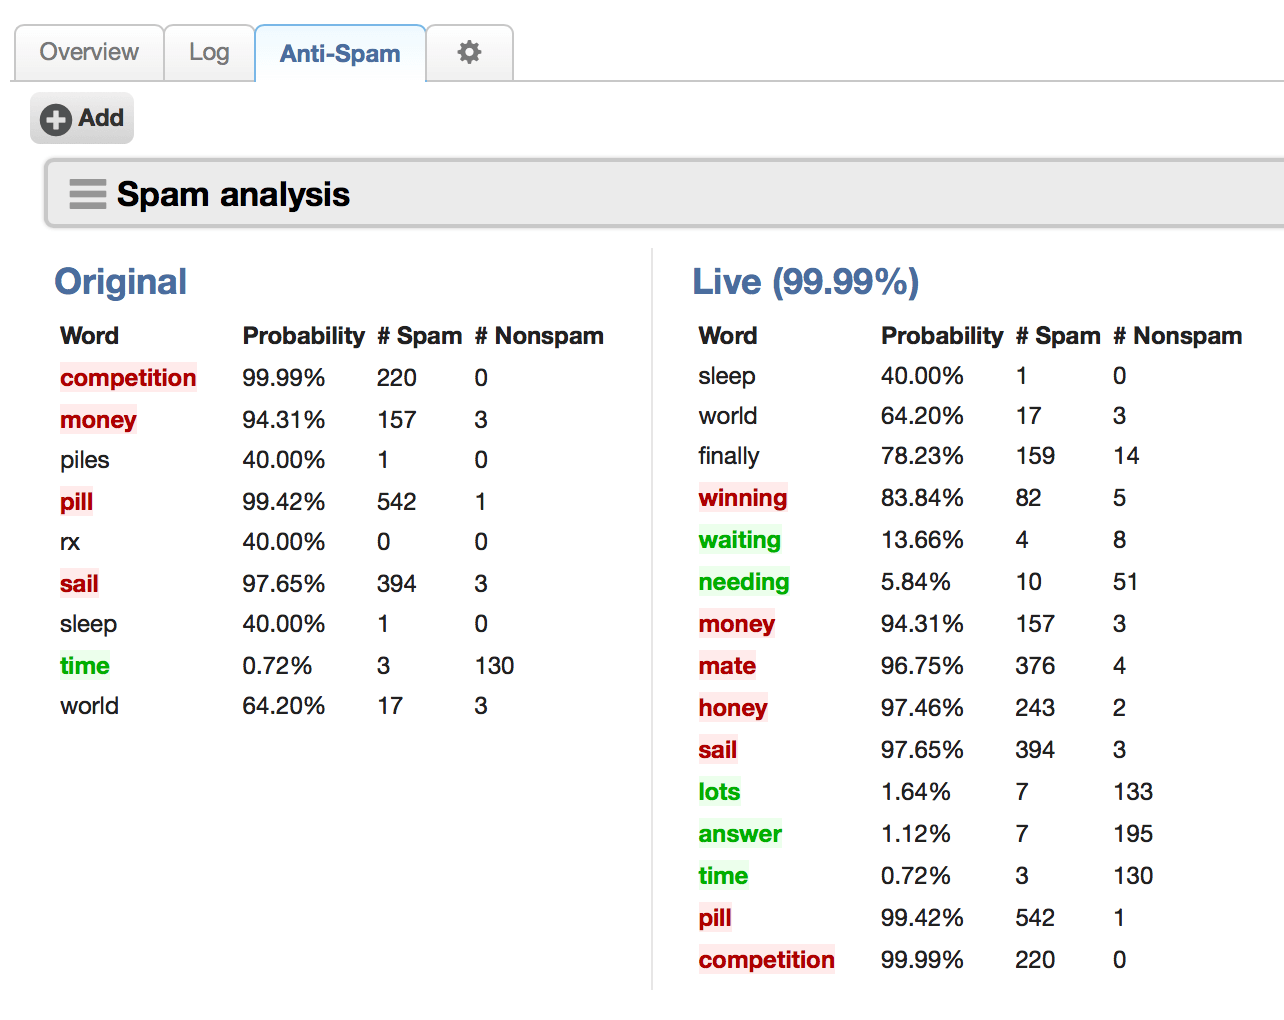
Spam Analysis
Added a 'Ticket Spam Analysis' widget to profile dashboards on ticket records. This replaces the 'Spam Analysis' plugin.
Custom (Bot-powered)
You can implement your own widget functionality using 'Custom' widgets and bots. [#87]
The content of a custom widget is generated using a 'Dashboard render widget' bot behavior. This allows data to be imported from anywhere, in nearly any format, and visualized however you want.
We have many reference examples using D3.js (e.g. line/bar/area charts, pie/donut charts, network graphs, word clouds, maps) that can be quickly adapted to your needs. This gives you full control over every aspect of the visualization: colors, axes, labels, etc.
Permalinks
When viewing a profile, appending a tab name to the URL (in permalink format) will automatically select that tab. This gives custom tabs the same functionality as the previously built-in tabs. For instance /log for 'Log' or /my-new-mail for 'My New Mail'.
Keyboard shortcuts
On profile dashboards, unhandled keyboard shortcuts are sent to widgets in order to give them an opportunity to respond. For instance, this allows an 'Actions' widget on ticket profiles to handle the close/spam/delete shortcuts, while also making them configurable and extensible.
Comments
On profiles, every record type that supports comments now has a 'Comment' button at the top of the page. When a comment is created, an event is sent to all profile widgets so they can refresh their content.

Mobile
Responsive design for mobile devices
Improved user interface responsiveness on small screens (e.g. mobile). This reduces/removes the need for the separate mobile interface.
The global search menu now properly adapts the number of columns based on the width of the browser.
When using Cerb with a mobile device, the logo and 'signed in' menu are now responsive. The 'signed in' menu will move to its own line if there isn't enough room.
When viewing Cerb with a mobile device, all popups now adapt properly to the width of the browser. Previously, most popups required scrolling – if they were usable at all.
When viewing worklists on small screens, subtotals now expand above the worklist rather than to the left.
On worklists, quick search is now easier to use on mobile devices. The query textbox spans the width of the browser, and the quick search menu adapts its width properly.
On mobile devices, it's now easier to reply to messages when viewing a ticket. The reply window adapts to the screen width, as do the properties below it (reopen at, etc).
On profiles dashboards with a sidebar, the sidebar will now always move to the top in single-column responsive mode. Previously, right-aligned sidebars were displayed at the bottom, which made it difficult to see the properties of a record (especially on tickets.
Improved support for iOS devices
Touch events
The 'jQuery UI Touch Punch' library (http://touchpunch.furf.com) is used to enable drag, sort, and resize UI functionality on iOS devices. Previously, touch-based mobile devices couldn't move cards on project boards, drag widgets, reorder tabs/fields, etc.
Home icon
On iOS devices, when using the "Add to Home Screen" option, a Cerb icon is now provided. Previously this was part of the now-deprecated mobile plugin.
Data Queries
Implemented a new 'Data Query' service for retrieving data in various formats with simple textual queries (much like quick search). These queries are also much easier to automate in bot behaviors, dashboard widgets, or the API.
Every data query begins by specifying a type, like type:worklist.subtotals. Other fields are available depending on the type of data being requested. Data is returned in JSON format.
Worklist metrics
Added a worklist.metrics type to data queries. This returns computed metrics based on worklist data (e.g. 'average ticket first response time over the past year').
Each values.* series should provide:
label:(human-friendly series name for visualizations)of:(record type)field:(record field using quick search keys)function:(count,min,max,average,sum)query:(the query to filter the results for this series)
Optionally, multiple functions can be specified for a series, like functions:[sum,average], and multiple series will be generated automatically using the same record type, field, and query.
A format: parameter can be provided to control how the results are returned:
table(default) returns tabular output, suitable for display with the 'Chart: Table' visualization widget. Multiple metrics are returned as rows.
For example:
type:worklist.metrics
values.total:(
  of:ticket
  field:response.first
  function:average
  query:(
    created:"-1 year"
    response.first:>0
  )
)
format:table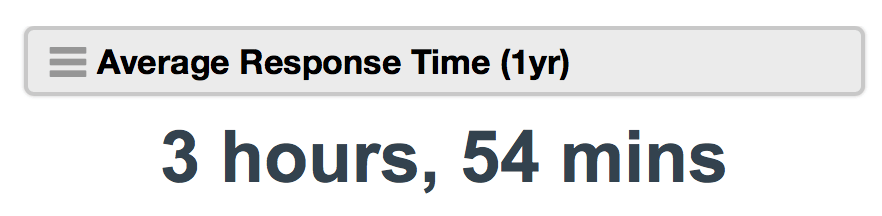
And using series expansion with functions:
type:worklist.metrics
values.response_time:(
  of:message
  functions:[average,min,max,sum,count]
  field:responseTime
  query:(
    worker.id:{{record_id}}
    created:"-1 month"
    isOutgoing:y
    isBroadcast:n
    responseTime:>0
  )
)
format:table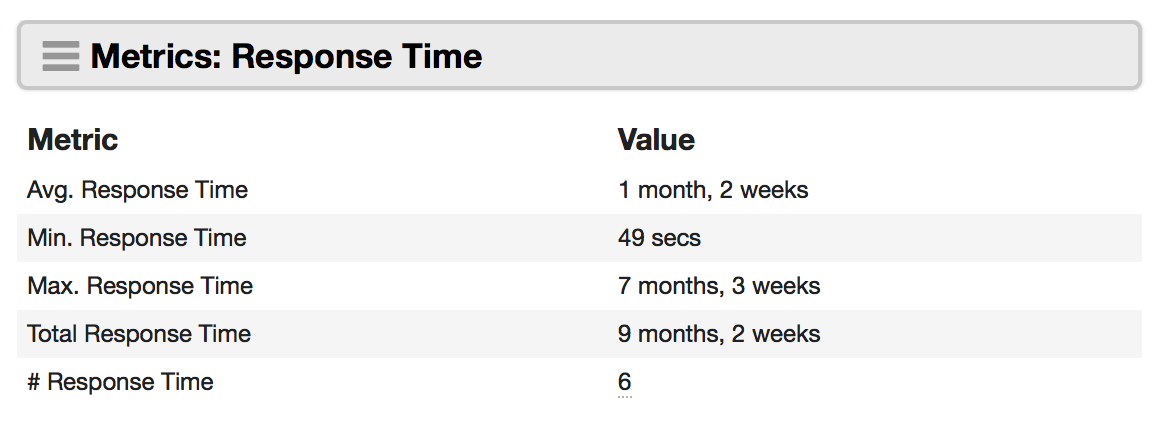
Worklist series
Added a worklist.series type to data queries. This returns series-based data from any worklist (e.g. tickets created by month by status). Data from multiple series of different record types can be returned in a single query.
Each series.* should provide:
label:(human-friendly series name for visualizations)of:(record type)x:(record field for the x-axis using quick search keys)y:(record field for the y-axis using quick search keys)function:(count,min,max,average,sum ony:field)query:(the query to filter the results for this series)
A format: parameter can be provided to control how the results are returned:
tablereturns tabular output, suitable for display with the 'Chart: Table' visualization widget.timeseries(default) returns time-based series data, suitable for display with the 'Chart: Time Series' visualization widget.
For example:
type:worklist.series
series.open_tickets:(
  of:tickets
  x:created@month
  y:id
  function:count
  query:(status:o)
)
series.closed_tickets:(
  of:tickets
  x:created@month
  y:id
  function:count
  query:(status:c)
)
format:timeseries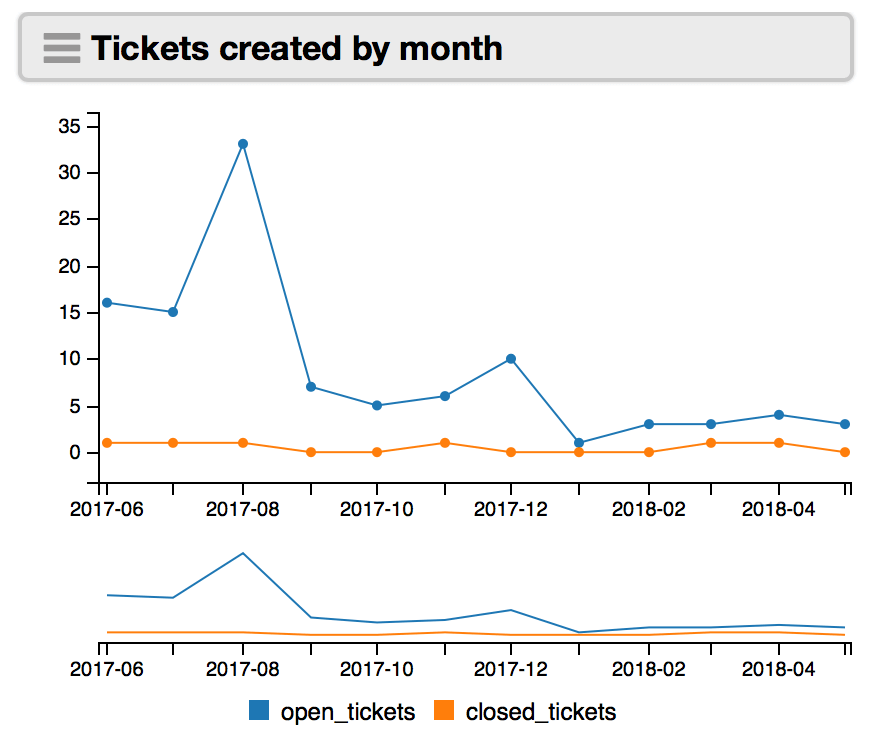
Worklist subtotals
Added a worklist.subtotals type to data queries. This runs aggregate functions against worklist data. Subtotals can be nested to any depth (e.g. "tickets by top 10 owners by status").
A format: parameter can be provided to control how the results are returned:
tree(default) returns hierarchal data (anameandvaluefor each node, and a list ofchildrenfor branches).categoriesreturns a series-based format suitable for bar charts.piereturns data for use in pie and donut charts.tablereturns tabular output, suitable for display with the 'Chart: Table' visualization widget. When nested subtotals are used, a row is returned for each distinct result (e.g. Support -> Kina, Support -> Janey).timeseriesreturns series-based data suitable for a time-series chart (with the 'x' axis values as timestamps).
Histograms can be created for date-based fields by appending a unit of time (e.g. @year, @month, @day) to the field name. For example:
type:worklist.subtotals
of:tickets
by:[created@month,group]
format:timeseries
The by: fields can specify a 'limit' and 'order'. These can be different for each set of nested subtotals. For instance, by:[created@month~10,org~25] returns records grouped by the top 10 created months, subgrouped by top 25 organizations for each month. Similarly, by:[group~-3] returns the "bottom" 3 groups (least frequently used).
The by: fields can specify links or links.* (e.g. links.org) fields. This could create a report like "Sum of time tracking entries linked to organizations by month".
A function: field may be provided with one of the following options: count, avg, sum, min, max. Count is the default. This affects the metric returned in the last subtotaled group (e.g. "Average first response time by worker by month").
For example:
type:worklist.subtotals
of:tickets
by:[owner~10,status]
query:(owner.id:any)
format:categories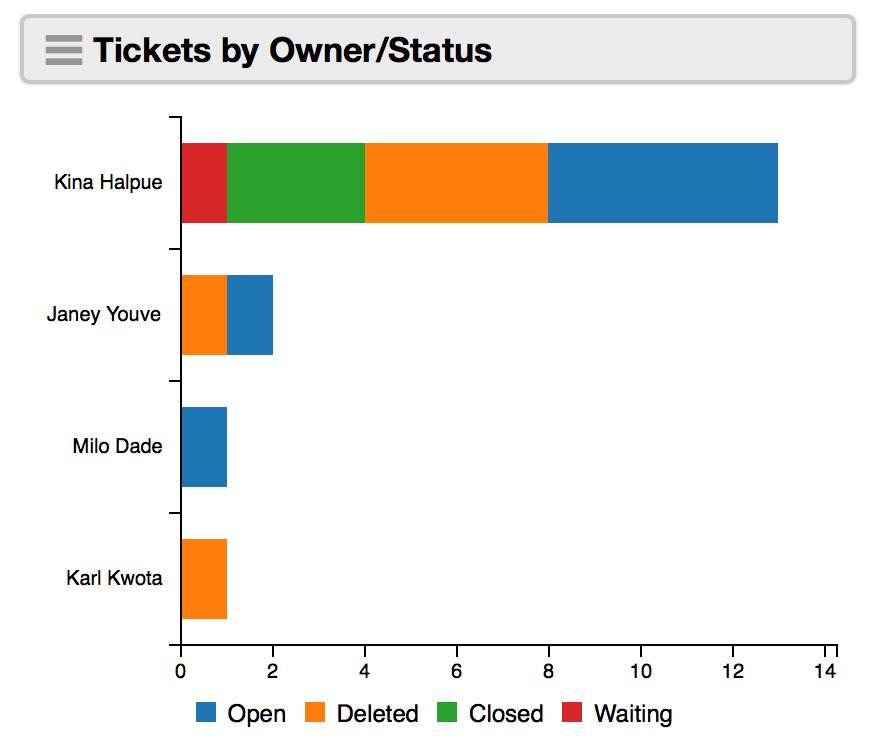
Worklist X/Y
Added a worklist.xy type to data queries. These plots two dimensional data to visualize clusters or correlations.
Each series.* should provide:
label:(human-friendly series name for visualizations)of:(record type)x:field(@year,month,day,hour,minute,second)y:(field)query:(the query to filter the results for this series)
You can specify a limit: and sort: within each series query:(). Nested sorting is supported, and sorts can be in ascending or descending order by prefixing a minus (-) to the field name for descending.
A format: parameter can be provided to control how results are returned:
pieformat returns data for pie and donut charts.categoriesreturns series-based data suitable for bar charts.scatterplot(default) returns series-based data suitable for a scatterplot chart.tablereturns data in a tabular (rows/columns) format suitable for "Chart: Table" visualization widgets.
For example:
type:worklist.xy
series.replies:(
  of:messages
  x:worker
  y:responseTime
  query:(
  	responseTime:>0
    sort:responseTime
    limit:10
  )
)
format:table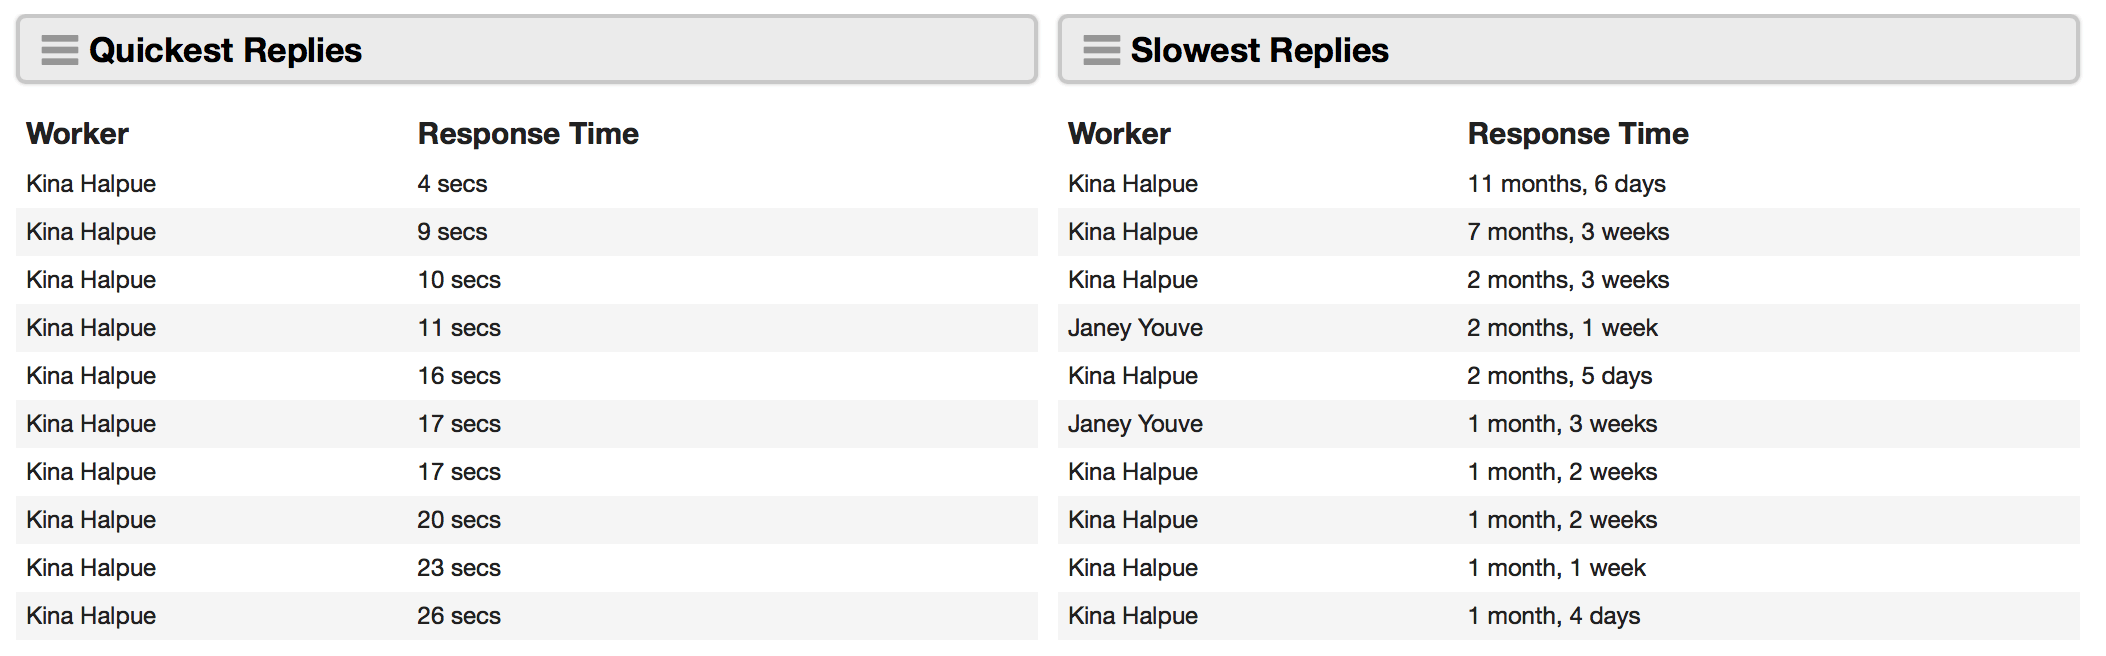
Usage: Bot Behaviors
Added a usage.behaviors type to data queries. This returns historical usage data for bot behaviors (e.g. uses, avg. runtime, and total runtime over time).
It currently supports the following format: options:
table(default) returns tabular data (columns and rows) suitable for the "Chart: Table" visualization widget.timeseriesreturns series-based data suitable for the "Chart: Time Series" visualization widget (the x-axis values are timestamps).
type:usage.behaviors
format:timeseries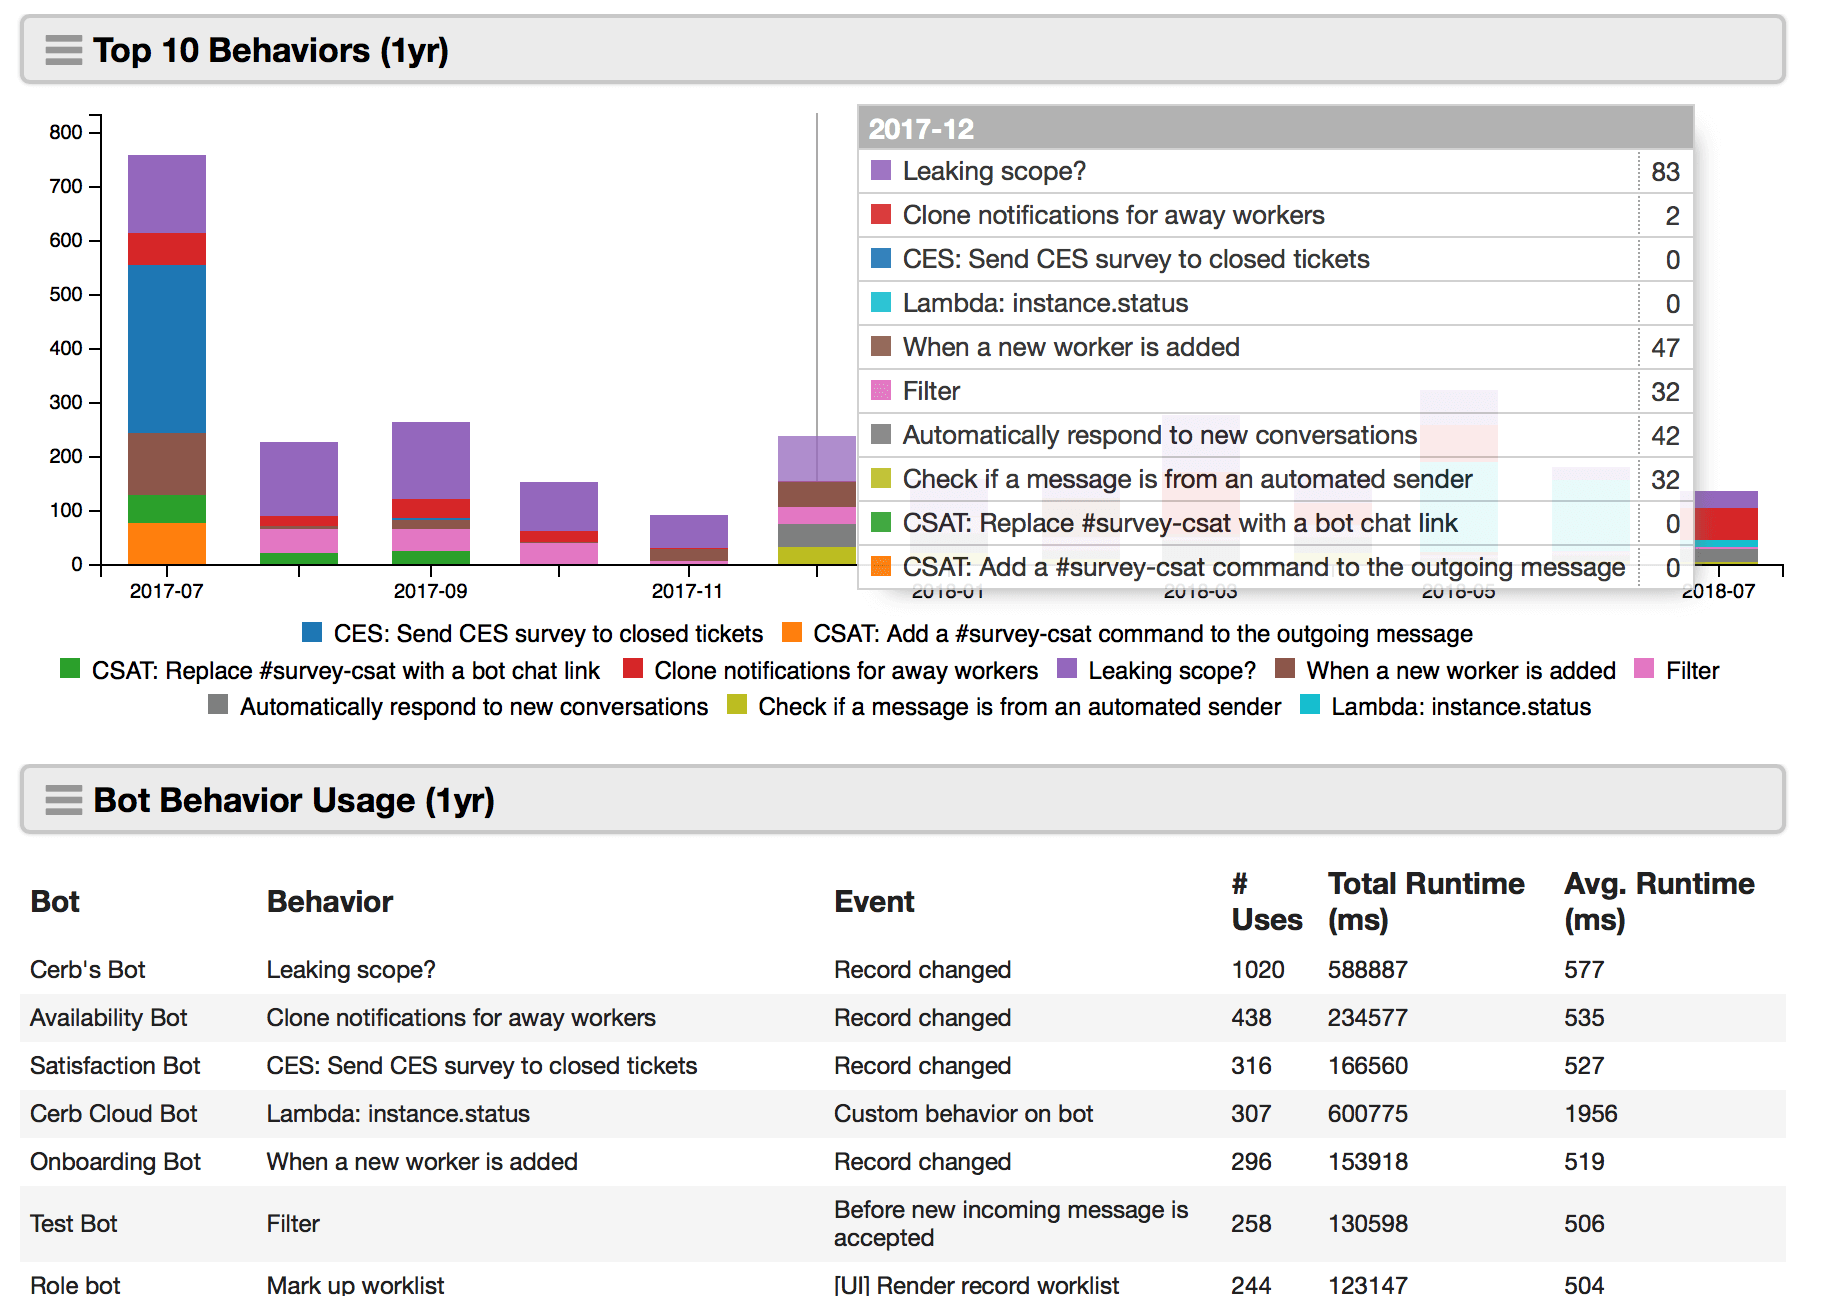
Usage: Snippets
Added a usage.snippets type to data queries. This returns historical usage data for snippets (e.g. uses by worker over time).
It currently supports the following format: options:
table(default) returns tabular data (columns and rows) suitable for the "Chart: Table" visualization widget.timeseriesreturns series-based data suitable for the "Chart: Time Series" visualization widget (the x-axis values are timestamps).
type:usage.snippets
format:timeseries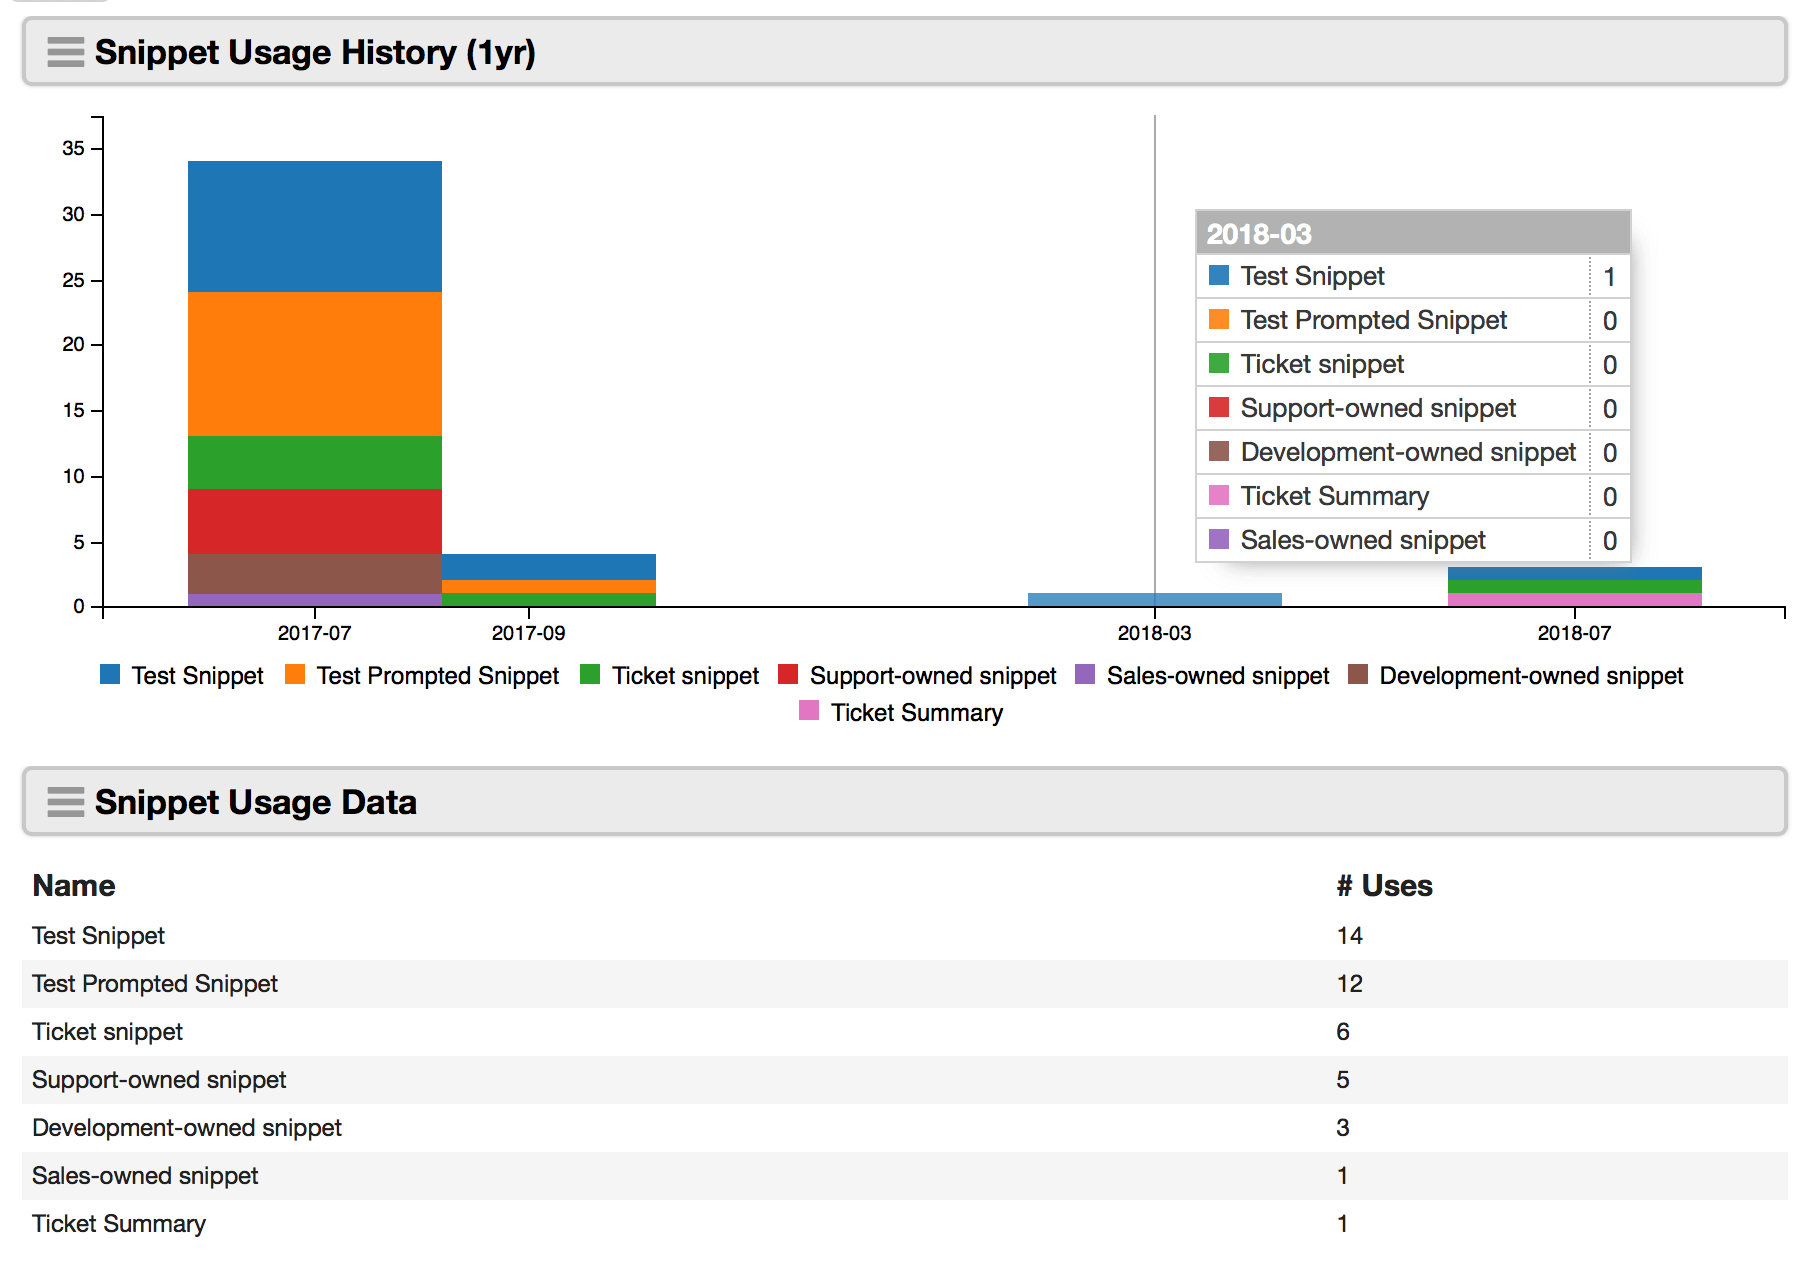
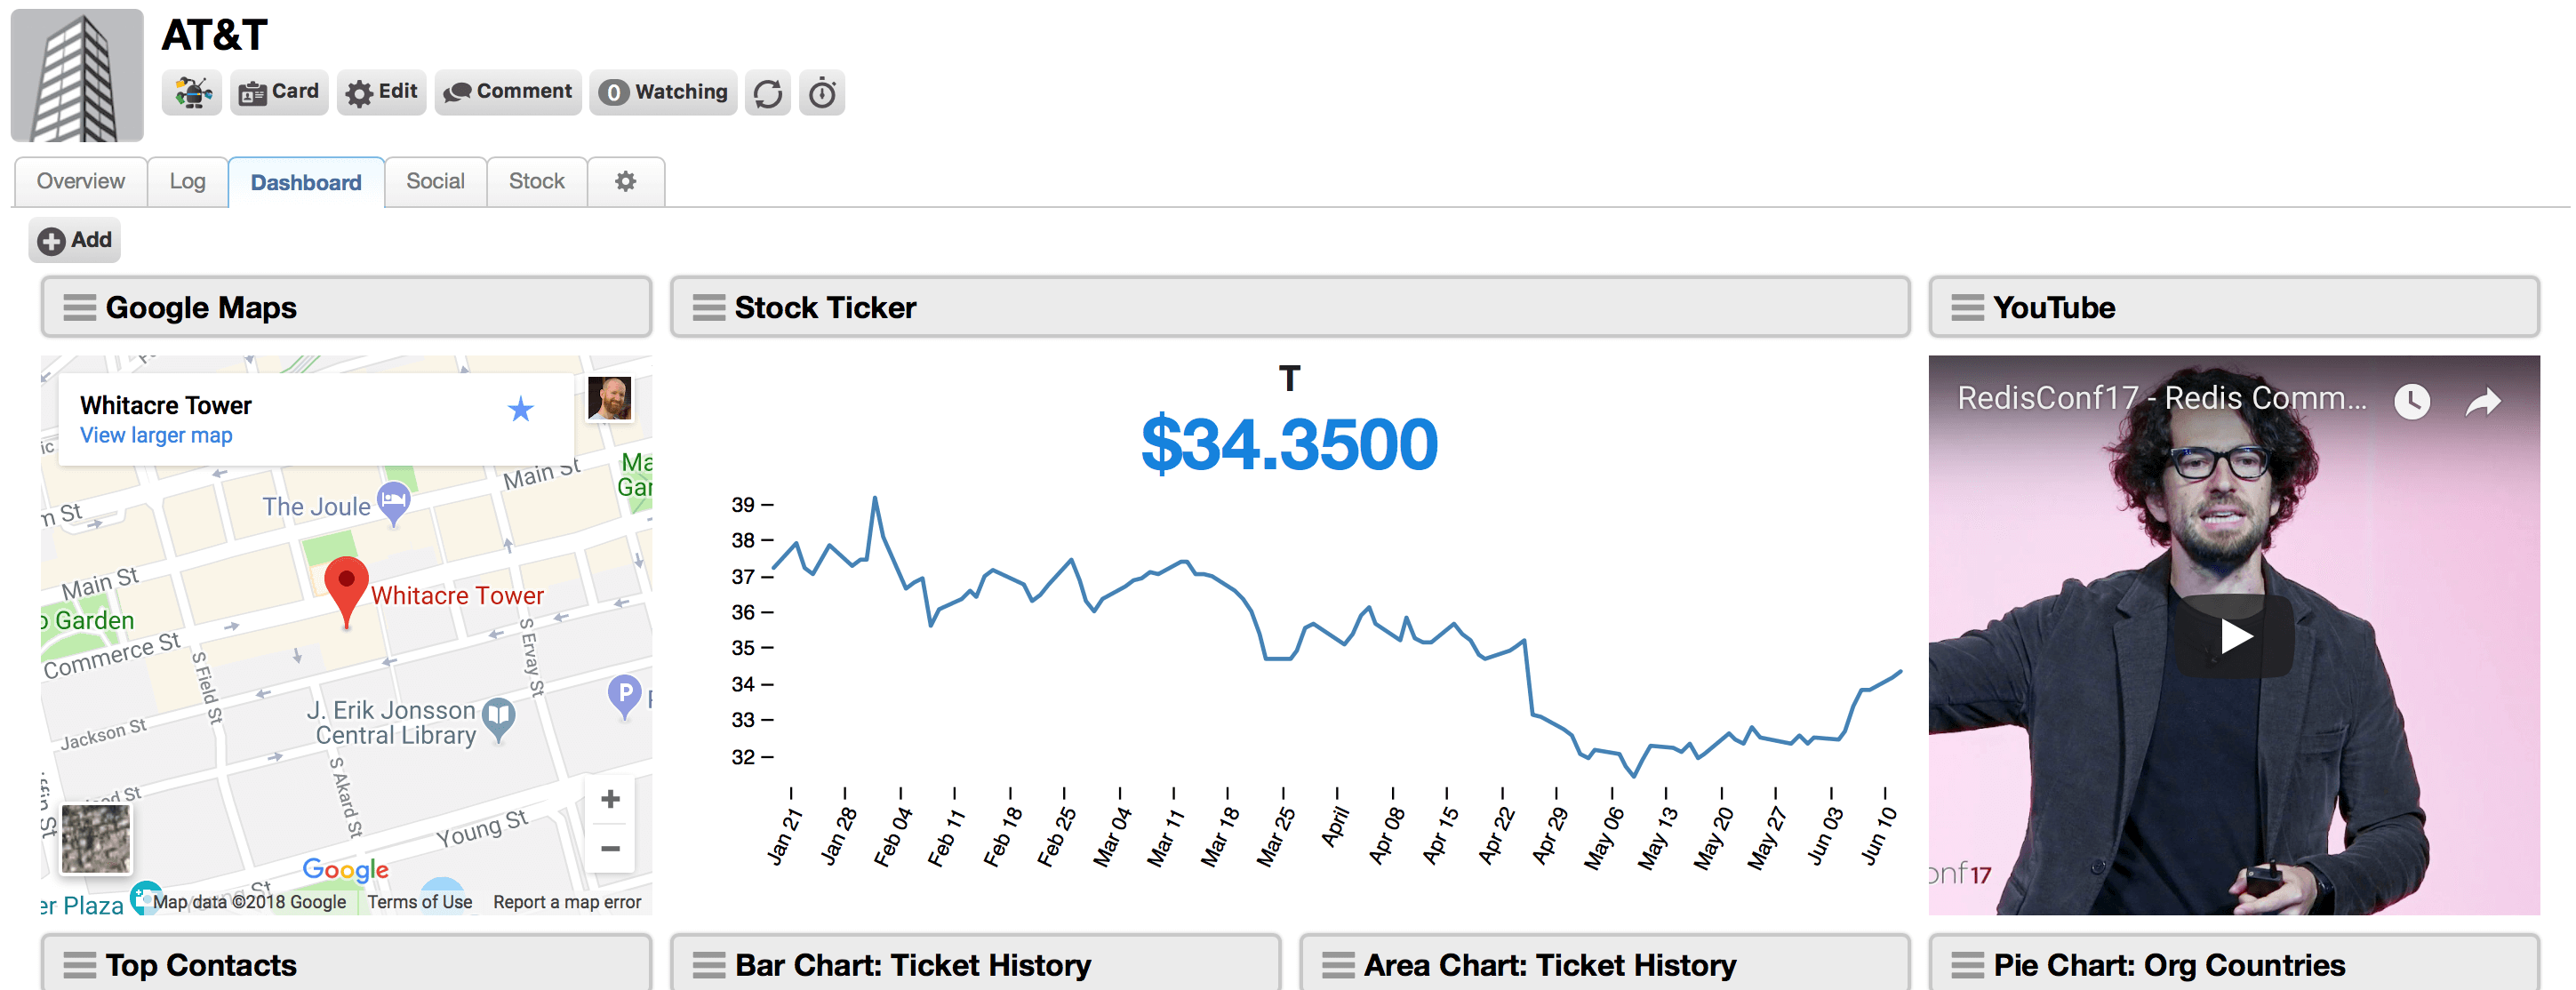
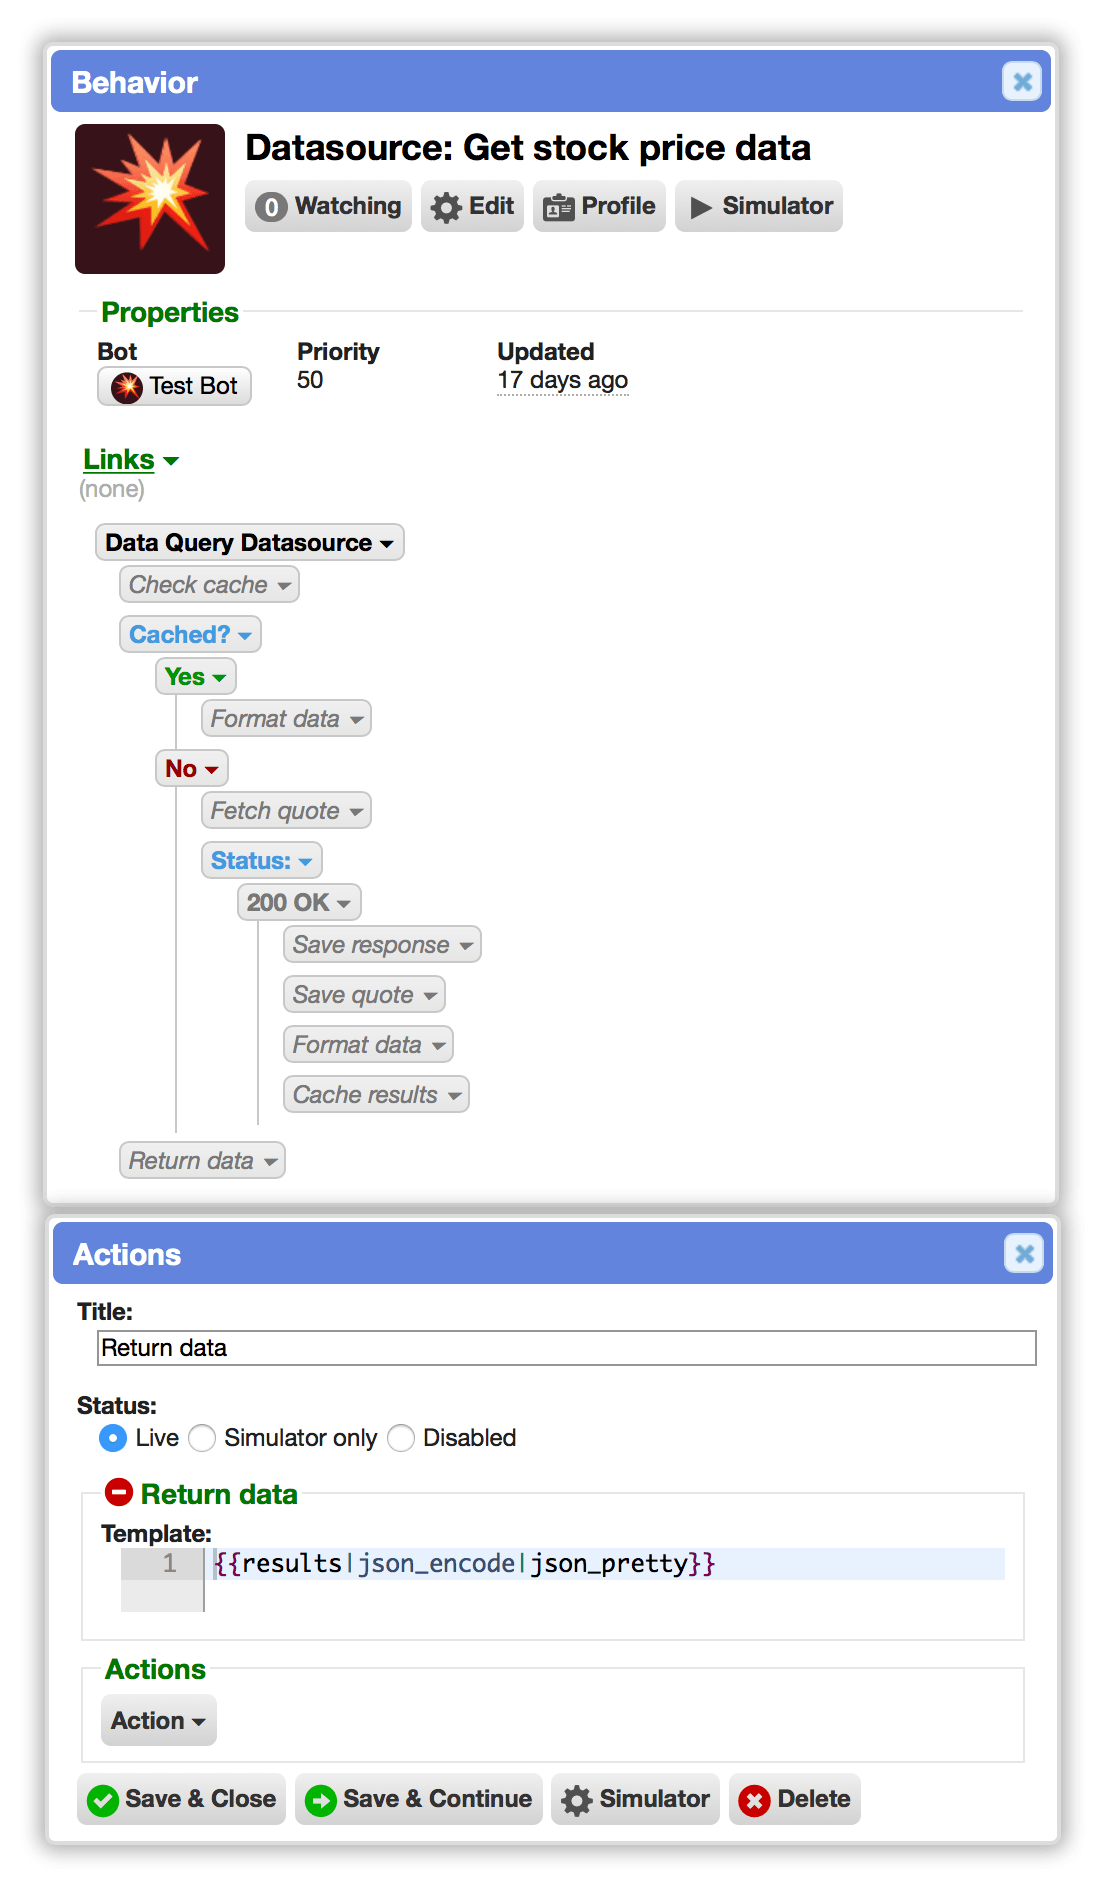
Bot-powered datasources
Added behavior.* types to data queries. Bot behaviors can be created on the 'Data Query Datasource' event. The alias configured there (e.g. get_stock_price) can be specified as a data query type (e.g. type:behavior.get_stock_price). Any arguments provided in the query are provided to the behavior as input variables. The behavior can gather data as needed (e.g. external APIs, worklist results, etc). Responses are returned in JSON format. This makes it much simpler to request data from bot behaviors from dashboard widgets, other bot behaviors, or the API.
Bot-provided datasources have a unique alias, and are invoked from a data query like:
type:behavior.aliasName
someParam:someValue
For example:
type:behavior.get_stock_price
symbol:AAPL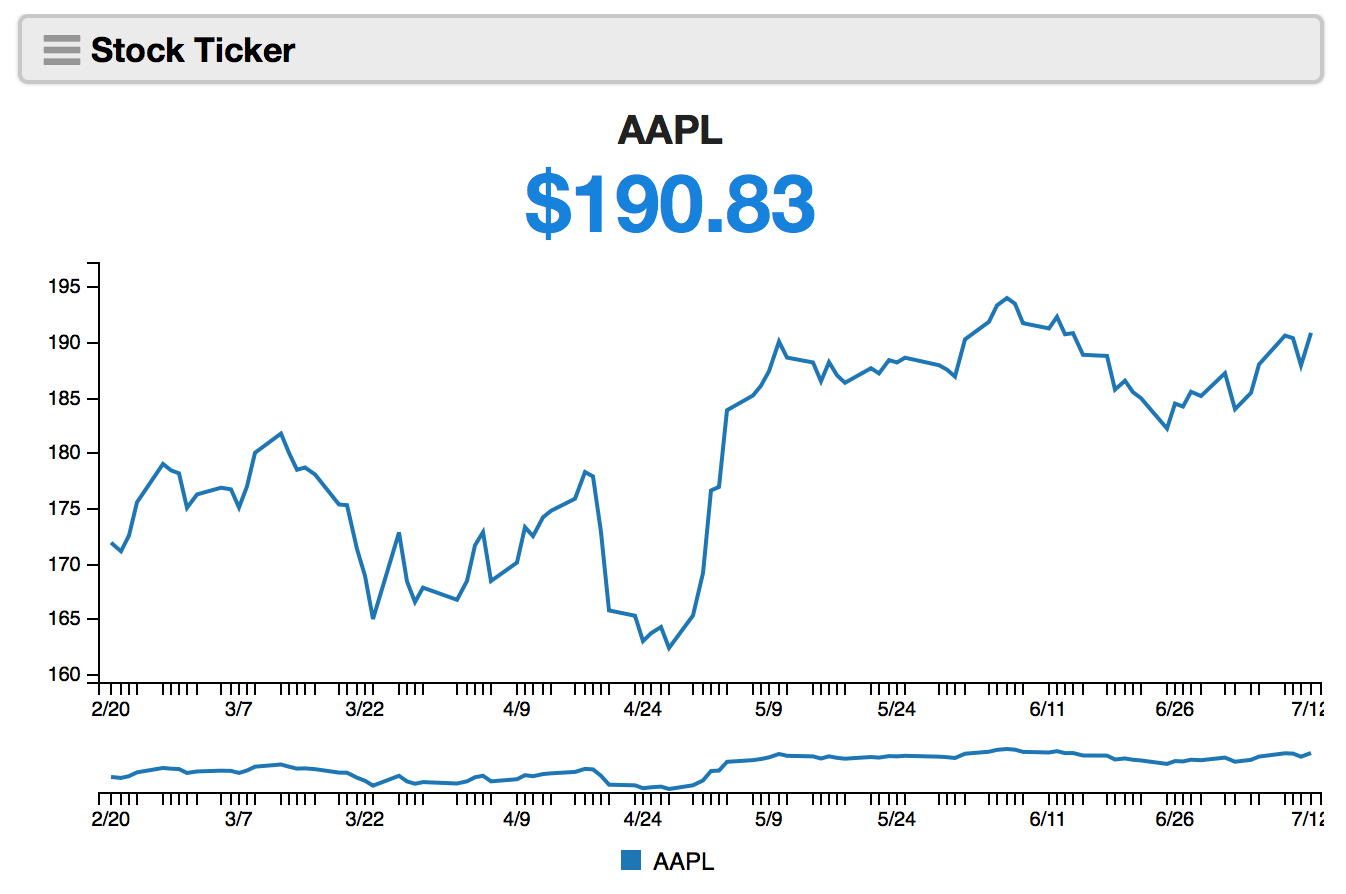
Bots can create behaviors on the 'Data Query Datasource' event. This allows data from any source (e.g. external API) to be returned from a data query. Data query parameters are sent to the bot behavior as input variables, and data is returned from the 'Return data' action as JSON.
Run data queries in any bot behavior
All bot behaviors can use the 'Execute data query' action to run a data query and retrieve the results. This is a much simpler way to exchange information between bots and APIs.
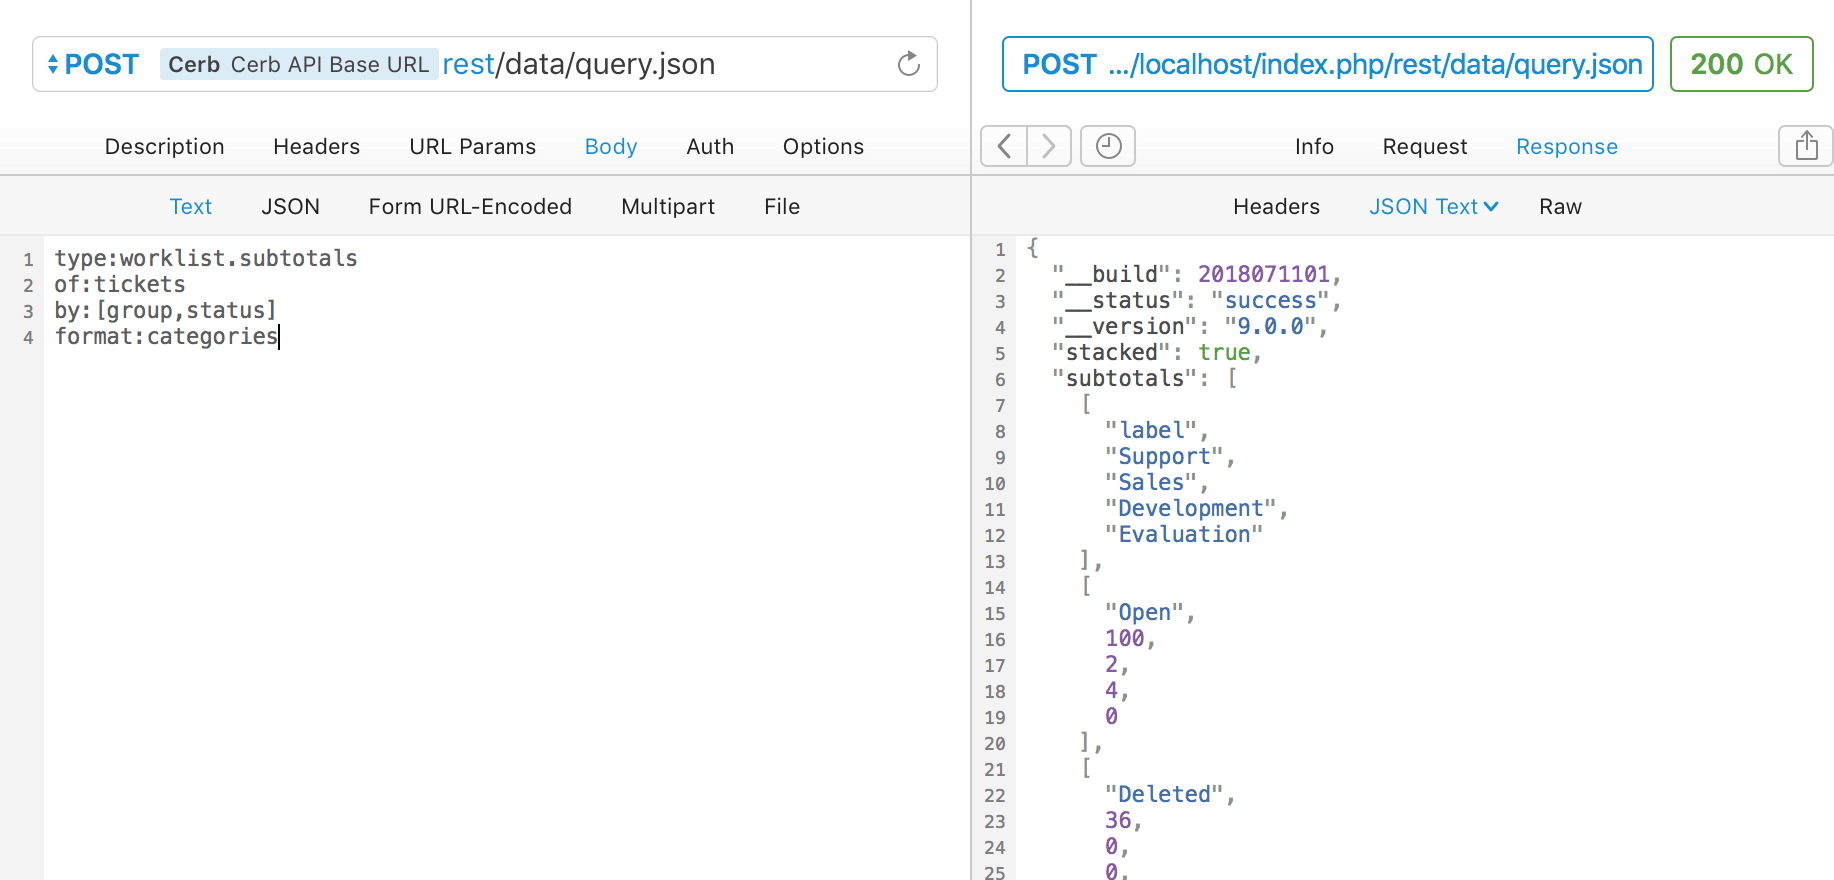
Run data queries from the API
Data queries can be run from the API using the /data/query endpoint.
For a GET the query should be provided in the q query parameter.
For a POST the query should be provided as text in the HTTP request body.
The results will always be in JSON format. This is now the recommended way to extract data from worklists and bots for use in other applications.
Removed legacy reports
Removed the legacy Reports plugin. These reports can now be created using dashboards and data queries. You can add a default reporting dashboard from "Help me create a page" when adding a new page.
Workspaces
Responsive workspace dashboards
Workspace dashboards are now responsive (like the new profile dashboards).
Layouts are available on workspace dashboards (e.g. sidebar-left).
Widgets have configurable widths (e.g. 25%, 50%, 75%, 100%) and are no longer constrained to vertical columns. Widgets are arranged in rows. Existing widgets are reordered during the update, so the top widgets from each previous column are now displayed on the first row, and so on.
On narrow displays (e.g. mobile devices), widgets collapse down to a single column. Placeholders (e.g. current worker, widget, workspace) can be used to configure widgets dynamically.
Dashboard widgets
Behavior Tree
Added 'Behavior Tree' widgets to workspace dashboards. This allows the decision trees of multiple behaviors to be displayed and edited on the same page.
Calendars
On workspace dashboards, calendar widgets now display full-size calendars rather than a minimalistic representation. The displayed calendar can also be configured using placeholders (e.g. the current worker's availability).
Chart: Categories
On workspace dashboards, added a new 'Chart: Categories' widget. This uses a data query to build bar or stacked bar charts (depending on whether multiple series are present in the results). This widget draws axis labels and each series can be toggled on/off. The charts are rotated so that categories have more label space along the left side, with quantitative values on the bottom.
The x and y axis labels can be formatted (e.g. text, number, seconds elapsed).
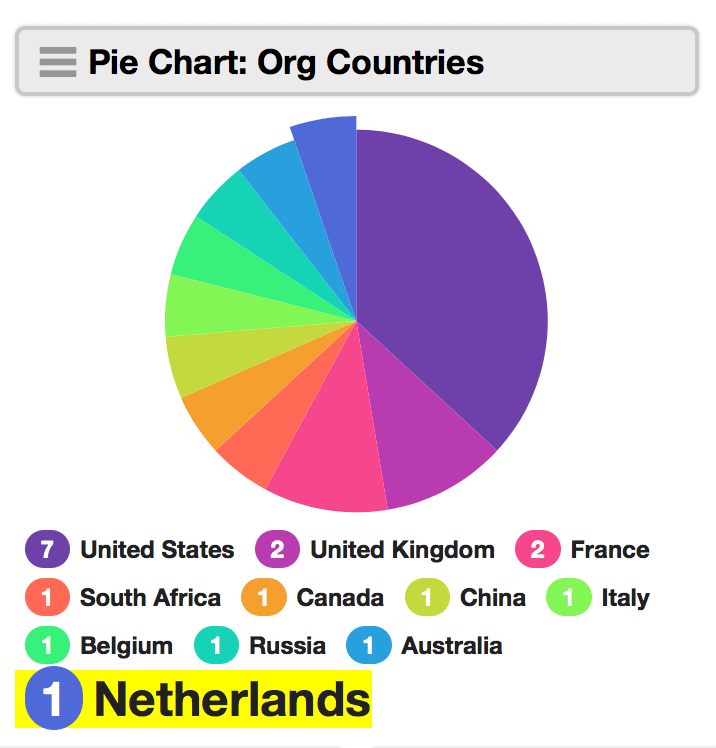
Chart: Pie
Added 'Chart: Pie' widgets to workspace dashboards. These use a worklist.subtotals data query as input and display either a pie or donut chart.
Legacy 'Pie Chart' widgets have been deprecated in favor of the new data-query based 'Chart: Pie' widget.
Chart: Scatterplot
On workspace dashboards, added 'Chart: Scatterplot' widgets. These plot two dimensional data to visualize clusters or correlations. The input is a data query (including bot behaviors). The axis values can be formatted as numbers or time elapsed.
Legacy 'Scatterplot' widgets have been deprecated in favor of the new data-query based 'Chart: Scatterplot' widget.
Chart: Table
On workspace dashboards, added 'Chart: Table' widgets. These display tabular data as columns and rows. The input is a data query. Many data query sources (e.g. worklist.subtotals) can accept format:table. Columns provide a name, label, and data type for their contents. Each row provides a set of keys and values. By default, column cells display the matching key for each row.
Chart: Time Series
On workspace dashboards, added a new 'Chart: Time Series' widget. This uses a data query to build time-based charts from worklist or bot-provided data. Multiple series are supported. The data can be displayed as line charts, splines, areas, bars, or stacked bars. A 'timeline brush' can be enabled below the chart for zooming in on selections of the data. Data points can be shown or hidden. The date format of the x-axis labels is also configurable.
The y-axis can be formatted as: number, time elapsed (minutes), or time elapsed (seconds).
Custom HTML
On workspace dashboards, 'Custom HTML' widgets have been deprecated in favor of bot behavior-based widgets on the 'Dashboard widget render' event. This is more secure and flexible than allowing arbitrary HTML and Javascript to be displayed (which has been sanitized since 8.x).
Knowledgebase Browser
Added 'Knowledgebase Browser' widgets to workspace dashboards. This allows knowledgebase categories and articles to be traversed from any workspace page. Legacy knowledgebase browser tabs are automatically converted to a dashboard with a knowledgebase browser widget.
Project Boards
Added 'Project Board' widgets to workspace dashboards. This allows a full project board to be mixed with other visualizations on the same page.
Record Fields
Added 'Record Fields' widgets to workspace dashboards. Like on profile dashboards, this card-like widget displays the configured fields for a given record, which can also be specified using placeholders. The widget can also display custom fieldsets and record links, as well as configurable quick search buttons.
Worklist
On workspace dashboards, 'Worklist' widgets no longer display a compact representation of the results. Full worklist functionality is now provided. Worklists are now completely configured from the widget editor: record type, required query, default query, records per page, color, and columns. Previously these options were configured by clicking the gear on each worklist.
When worklist widgets on workspace dashboards are migrated to the new format, their label will have '(!)' appended if they require attention. These widgets need to be converted from the old-style filters to a required query. The old parameters are displayed in a comment on the 'query' field and should be deleted after the required query is created.
Data queries on counters and gauges
On workspace dashboards, Counter and Gauge widgets can now use data queries as a datasource.
Permalinks
When viewing a workspace page, appending a tab name to the URL (in permalink format) will automatically select that tab. For instance /overview for 'Overview' or /available-work for 'Available Work'.
Deprecated workspace features
Deprecated widget types are now hidden when adding new widgets to a dashboard. This allows existing widgets to continue working while being phased out.
On workspace dashboards, the old 'Line chart' and 'Bar chart' widgets have been deprecated in favor of the new data query-based chart widgets.
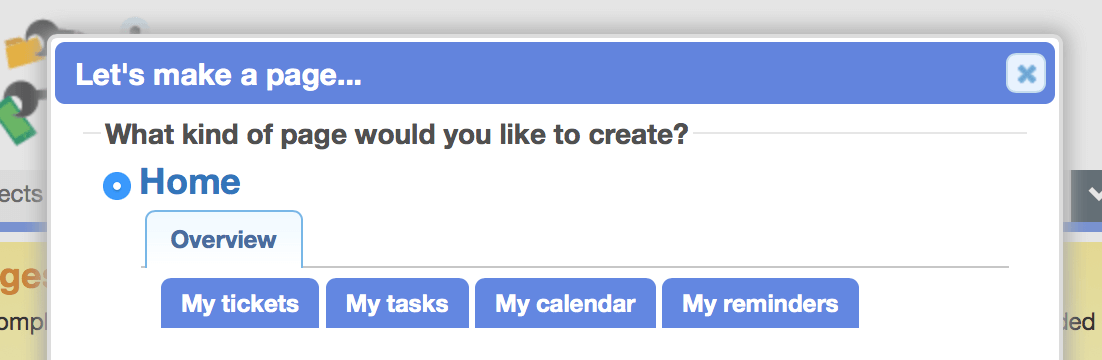
Create a home dashboard
On workspaces, the 'Help me create a page' wizard can now create a 'Home' page with an overview dashboard. This shows: My tickets, My tasks, My calendar, and My reminders.
Improved avatar image performance
Worklists will now only show avatar images when there are fewer than 50 records on the current page (e.g. contacts, orgs, workers). This addresses excessive image requests from worklists with 500-999+ rows.
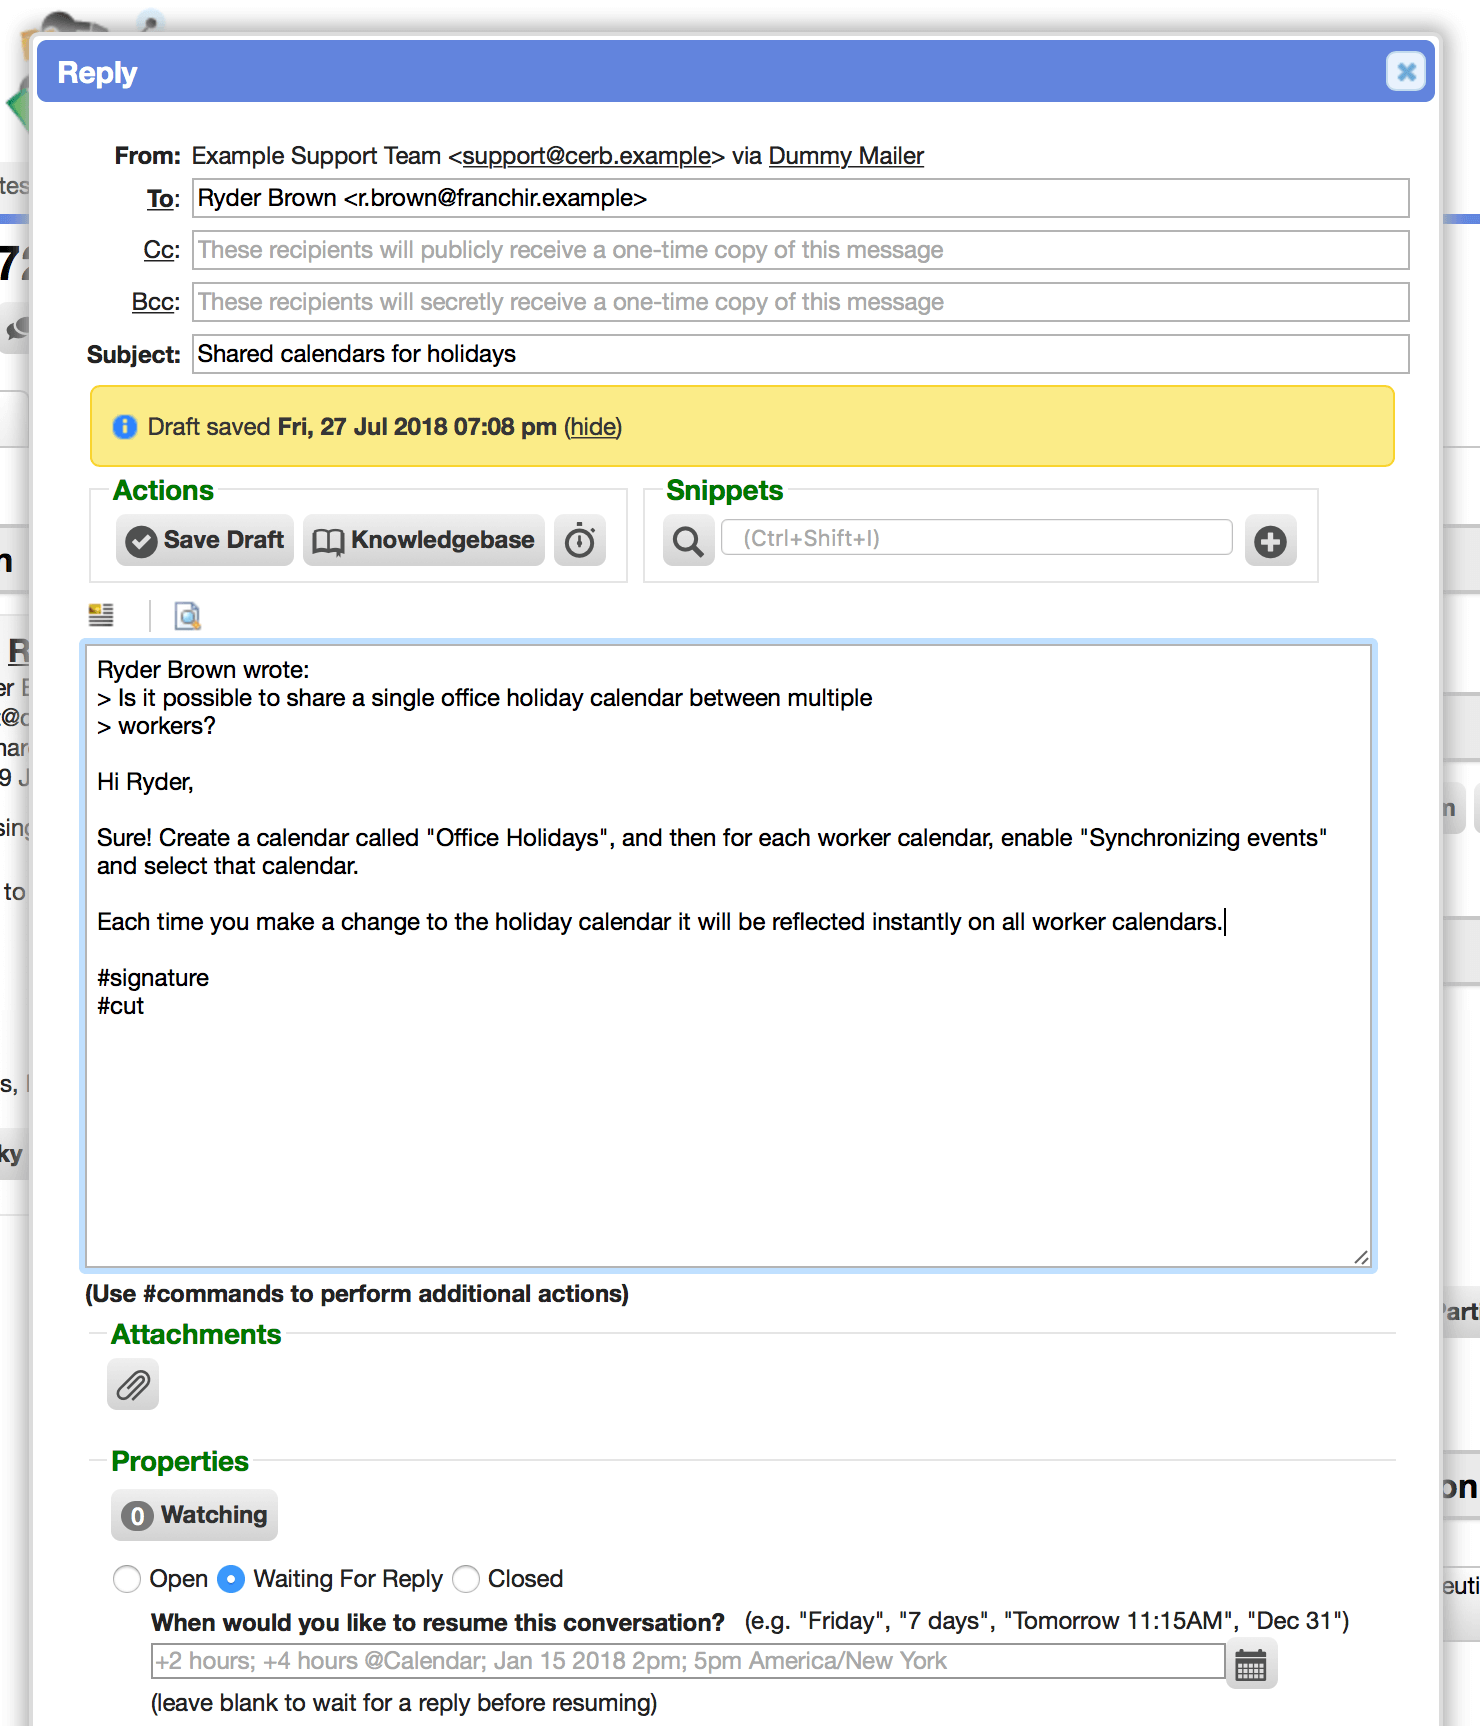
Reply popups
Replying to ticket messages is now handled in a popup editor, similar to composing new mail. This allows more of the screen width to be used when the conversation widget is in a narrow column on ticket profiles.
Reply from ticket cards and worklists
Tickets can now be replied to from their card popups (from any worklist) without having to visit their profile. This provides full functionality (auto-saving drafts, snippets, collision of effort detection, etc). [#88]
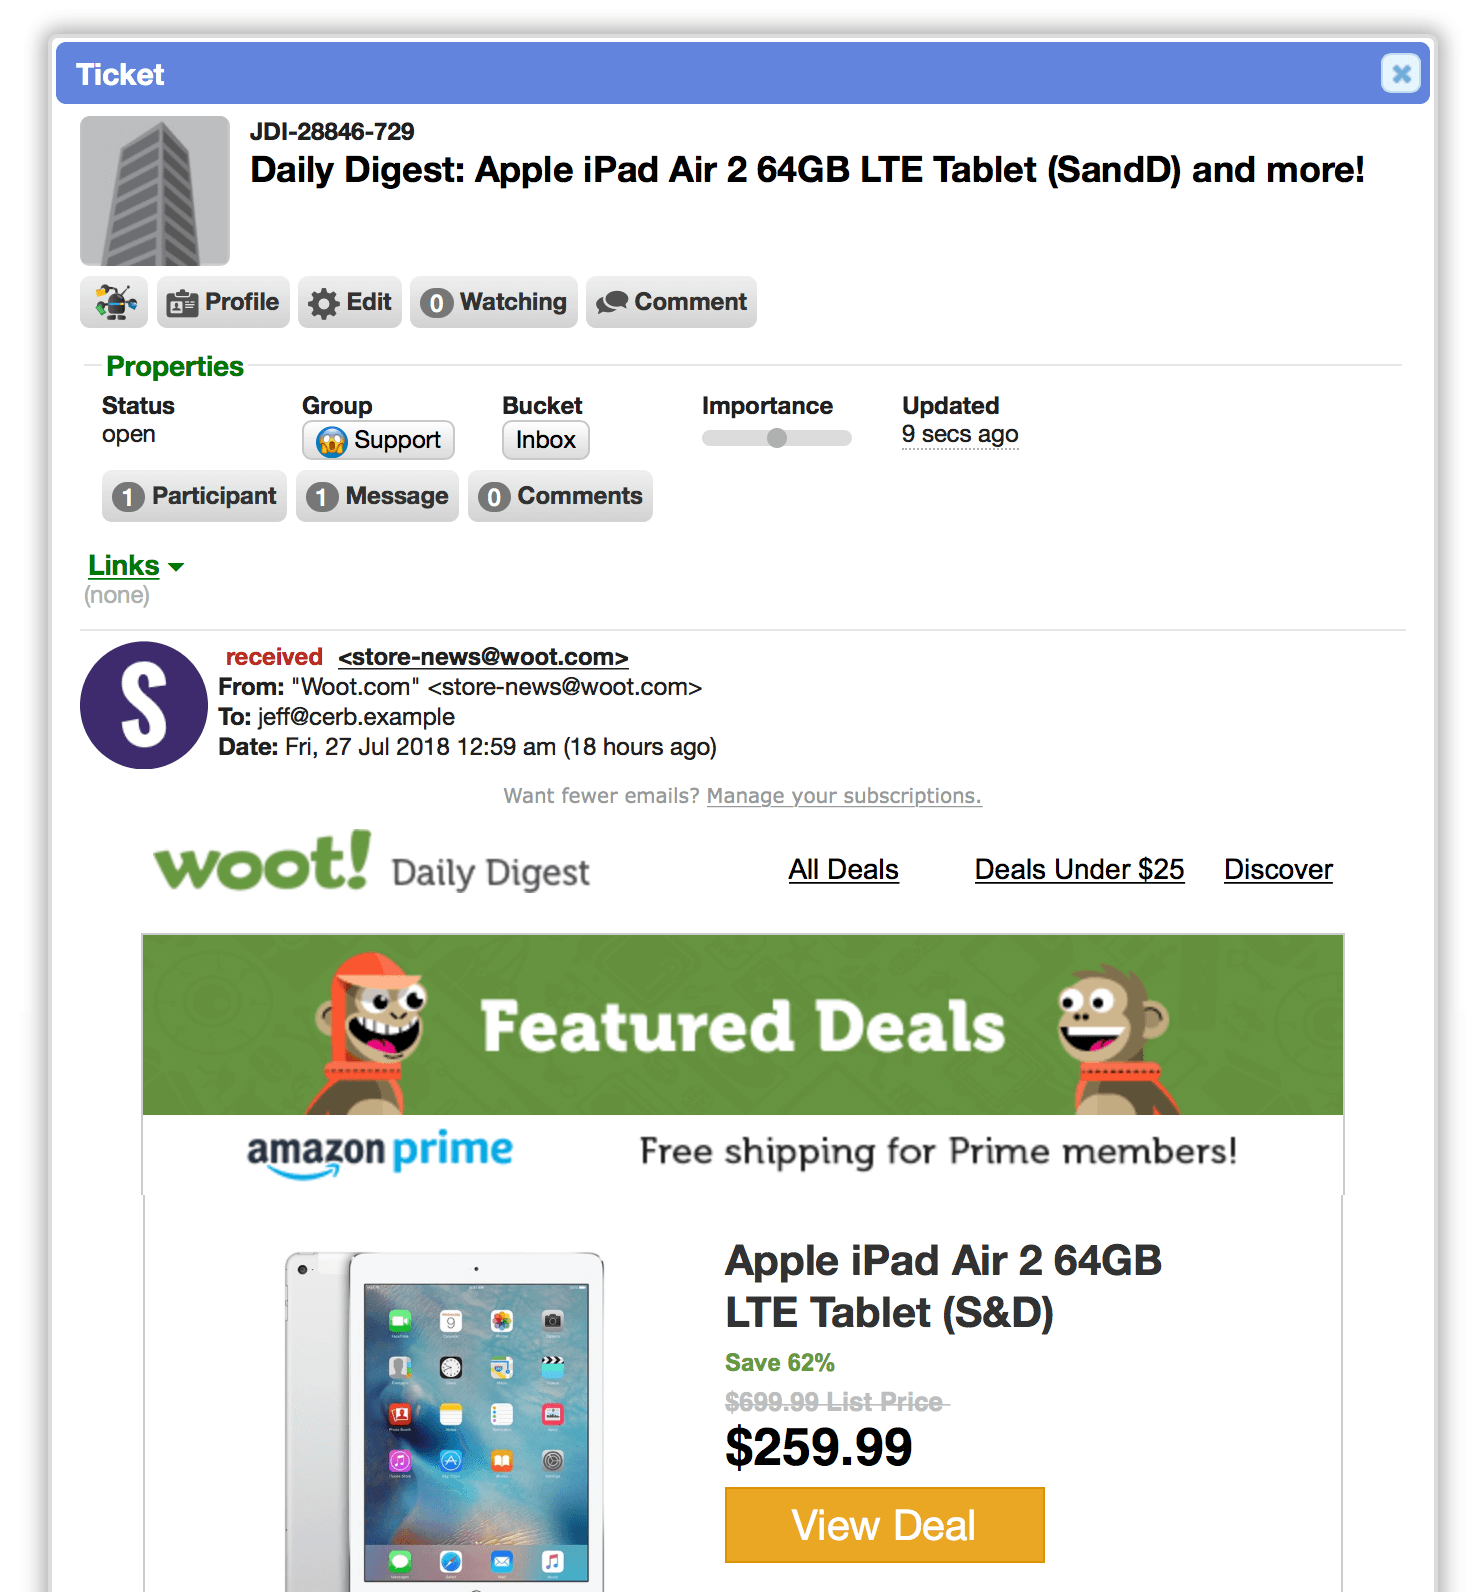
Preview HTML messages on ticket cards
On ticket cards, message previews now display the HTML version when available. Previously, ticket card popups always displayed the plaintext version of a message.
Cards
Customizable search buttons
On cards for every record type, custom search buttons can now be configured by administrators. These will be displayed on cards for every worker.
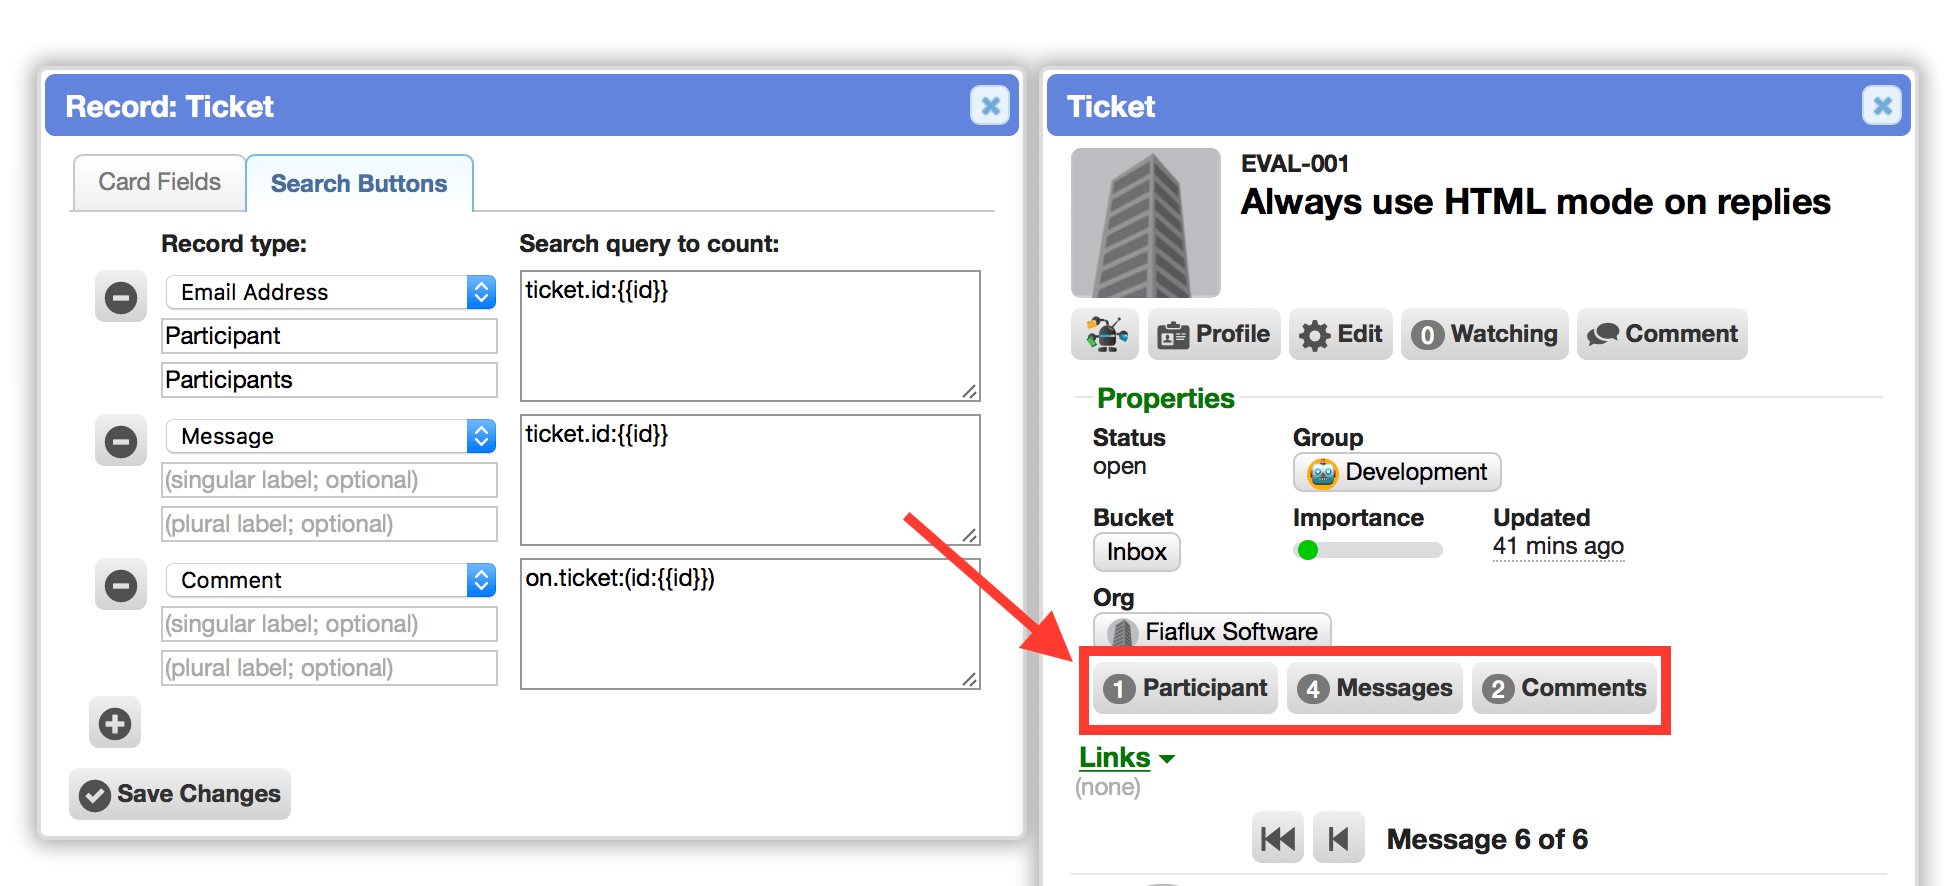
To build a custom search button, all you need to provide is a record type, singular label, plural label, and search query for the count.
Placeholders for the current record in the card can be used to construct the query; and the count can be based on any field on any linked record.
This is particularly useful to relate custom records to each other (e.g. Instructor->Courses).
Search buttons can be dragged into the desired order.
All of the built-in buttons (like Ticket->Participants, and Group->Members) have been moved to the editable search buttons, so they can be copied, changed, or removed.
File Uploads
Implemented a new file uploader using HTML5 and removed the legacy IFRAME approach. When uploading files, progress bars now display the current progress for each transfer.
When uploading multiple files at once, each file can now use the maximum file size configured on the server. Previously, the upload limit was shared between all files being uploaded.
Bots
User experience
Added a loading animation to the floating bot interactions menu in the bottom right.
Scripting
-
Added a
|cerb_translatefilter to bot scripting. This converts string IDs (likestatus.open) into text in the current worker's language. -
Added a
cerb_has_priv(priv, actor_context, actor_id)function to bot scripting. This returns a boolean depending on whether the given actor has the given privilege among their roles. If no actor is given, the current worker is assumed. This allows bot functionality, snippets, and widgets, to adapt based on worker permissions. This is particularly useful in HTML-based profile widgets. -
Added
cerb_record_readable(record_context, record_id, actor_context, actor_id)andcerb_record_writeable(record_context, record_id, actor_context, actor_id)functions to bot scripting. These return a boolean if the given actor has read or write access to the given record. If no actor is provided then the current worker is assumed. This allows bots and widgets to adapt based on record permissions. For instance, an HTML widget on a profile dashboard could only show a button to workers who can modify the record. -
Added an
array_combine(keys,values)function to bot scripting. This combines two arrays into the keys and values of a single associative array. -
Added an
array_intersect(array1,array2)function to bot scripting. This returns a new array for all the elements inarray1that are also present inarray2. This is the opposite ofarray_diff(). -
Added an
array_sort_keys(array)function to bot scripting. This sorts an associative array by its keys rather than its values. -
Added an
array_unique(array)function to bot scripting. This returns a new array with only the distinct values from thearrayargument. -
Added an
array_values(array)function to bot scripting. This returns the values from an associative array as a new indexed array. For instance, this can affect the output in JSON encoding by using[]rather than{key:value}.
Added help resources to prompt actions in conversational bots
On interaction-based bot behaviors, added help links to the 'Prompt with…' actions which refer to the official documentation.
Quick search
Remember the last query on worklists
On all worklists, the previously used search query is now remembered even when the list is closed and returned to later. This makes it much easier to modify the existing filters. Previously, the search query field was blank upon return and the query had to be tediously reconstructed.
Placeholders for quick search queries
Improved placeholders in worklist quick search queries. Previously these were inconsistent between the UI, API, and bots. [#64] [#65]
Subtotal from quick search queries
When searching worklists with queries, a subtotal: filter can be provided to also return subtotals on the given field. This is particularly helpful when configuring worklist widgets.
Sort hints in the quick search menu
In the search menu for all worklists, added a sort: submenu to display the available sort fields. This also allows adding sorts in ascending or descending order.
Subtotal hints in the quick search menu
In the search menu for all worklists, added a subtotal: submenu to display which fields the records can be subtotaled on from a query.
Filter by custom fieldset on records
Added a fieldset: filter to search queries on all records. This allows deep searching against any linked custom fieldsets.
Miscellaneous filters
-
Attachment records can be filtered by
storage.extension -
Community portal worklists can be filtered by
type: -
Contact records can be filtered by
gender: -
Mail transport worklists can be filtered by
type: -
Mailbox worklists can be filtered by
host:andprotocol: -
Opportunity worklists can be subtotaled and filtered by
currency: -
Ticket worklists using the
participant.id:filter now display as "any of these (10 people)" when more than three values are given. -
Time tracking records can be filtered by
activity.id: -
Workspace widget worklists can be filtered by
type:
Records
Created dates on custom records
Added the Created at field to custom records. Previously, only Updated at was being tracked. [#688]
Records configuration
In Setup, there's a new 'Records' menu for record-related configuration (cards, custom fields, avatars, etc). These options used to be buried in the 'Configure' menu.
Permalinks for drafts
On ticket profiles, drafts now have a 'Permalink' button for generating a sharing link back to the draft. This works like the links for messages and comments, where the draft is scrolled into view and highlighted with a brief animation.
Custom fieldset improvements
-
The custom fieldsets feature no longer uses record links to associate fieldsets to records. This is now handled with a dedicated table which improves performance and simplifies maintenance.
-
Fixed an issue where moving a custom field between fieldsets didn't link existing records with that field with the new fieldset.
Cards, profile pages, and worklists for scheduled behaviors
Scheduled behavior records now have cards, profile pages, and worklists. They are accessible from the global search menu. Scheduled behaviors can be created and modified from the records API via REST and bots. [#634]
When creating scheduled behaviors through the API or from bots, the variables field can now be set as a JSON object of variable names (as keys) and their values.
Cards, profile pages, and worklists for time tracking activities
Added cards and profiles for time tracking activity records. New activities can now be added from the global 'Search' menu. Activity records can have custom fields, link to other records, etc.
Contact autocompletion
Improved the usability and performance of contact record autocompletion. Previously, there was no limit on the number of unsorted results. This could lead to excessive contact profile picture requests on the server. Now, results are sorted by the number of messages received from the client, and limited to the top 25.
Miscellaneous improvements
-
Behavior worklists now default to sorting by the most recently updated records.
-
Worker custom fields on worklists now open a card popup rather than redirecting to the profile page.
-
Project board column worklists can now be subtotaled by their parent project board.
-
Worker worklists can now be subtotaled by group.
Removed legacy features
-
Removed the legacy 'Mobile' plugin since the primary UI should work responsively on mobile devices now.
-
On worklists, removed the 'Filter:' menu along with the old style of adding individual filters. Quick search queries handle everything now in a far more flexible and expressive way (booleans, groups, deep search, sets, negation, etc).
-
Removed the built-in 'Mail History' tabs on profiles since they can be reimplemented using profile custom tabs using worklist widgets.
-
Removed the built-in 'Calendar' and 'Availability' tabs on worker profiles since they can be reimplemented using profile custom tabs and calendar widgets.
-
Removed the built-in 'Responsibilities' tabs on group and worker profiles since they can be reimplemented using profile custom tabs and responsibility widgets.
-
Removed the legacy 'filter presets' feature. This had been deprecated by 'saved searches' in 8.x, which use queries rather than legacy filters.
-
Removed the legacy 'Print' feature from tickets and messages. This is well-handled by browsers and CSS now.
-
Removed the legacy 'Include activity log entries in the timeline' worker preference. This can now be done more cleanly using profile dashboards by adding an activity log worklist.
-
Removed profile tab extensions from plugins (
Extension_ContextProfileTab) in favor of the new profile tab records (built through the UI). -
Removed explorer mode toolbar extensions (
Extension_ExplorerToolbar) in favor of bot interactions.
UI
User-defined stylesheet
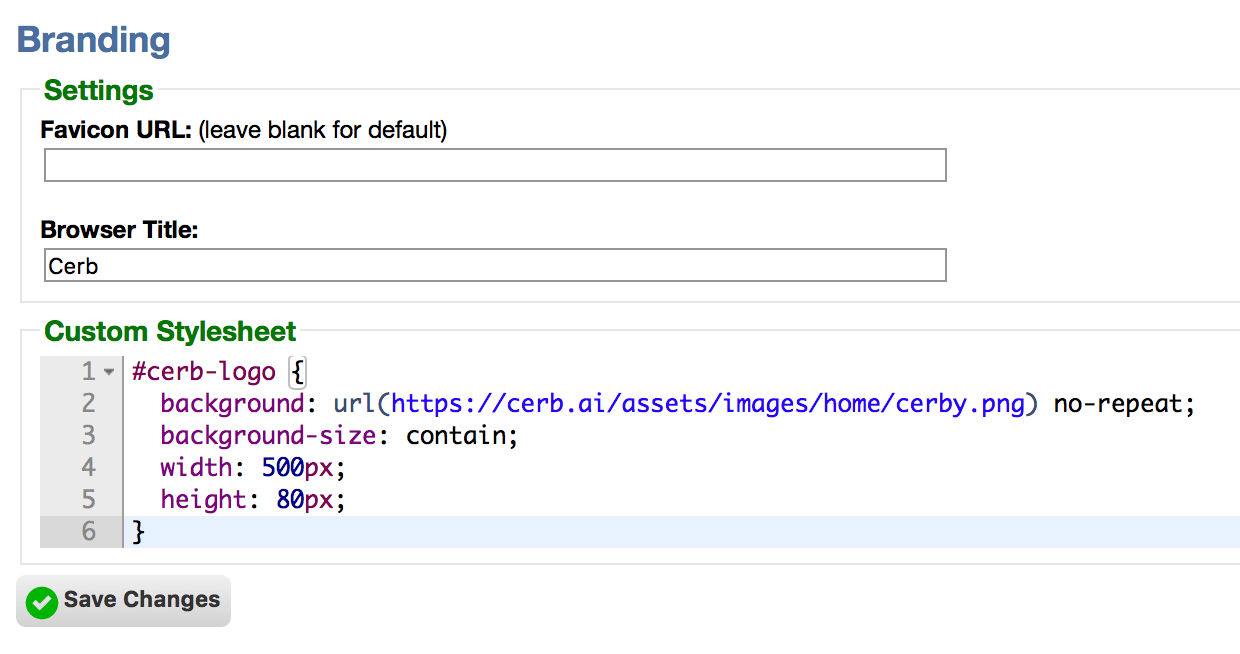
In Setup->Configure->Branding, a user-defined stylesheet can now be provided to override CSS styles in Cerb's UI (e.g. fonts, colors, sizes).
The logo has been converted from an image to a <div> named #logo using background images. Any existing logo image has been converted to CSS. This allows for responsive logo images (including alternate @2X images for high resolution displays).
Mobile UX
-
On project boards, columns now have drag handles. This helps prevent accidental drag/drops, especially on mobile devices.
-
Improved the responsiveness of the explorer mode header on mobile devices.
-
Clicking on the worker menu link now toggles the menu open/closed. Previously the link always opened the menu and did nothing if it was already open. This made it difficult to close the menu on mobile devices.
Platform
Developers
-
Added
Devblocks.loadScript(url,callback)andDevblocks.loadScripts(urls,callback)helpers to the Javascript library. This allows plugins and widgets to lazy load third-party scripts. Scripts are loaded in parallel, browser cache is utilized, and multiple requests for the same script will only fetch it once. -
Added
Devblocks.loadStylesheet()andDevblocks.loadResources()helpers to the Javascript library. This allows plugins, widgets, and bot interactions to "lazy load" stylesheets and other resources. Similar to.loadScripts(), resources are loaded in parallel, cached, and only fetched once.
Performance
Optimized HTML sanitization performance
Optimized HTML sanitization when used in a loop (e.g. project boards).
Dependencies
-
Added the D3.js Javascript library for client-side visualizations on dashboards.
-
Added the C3.js Javascript library for simplifying the use of D3.js for the creation of common charts and visualizations in dashboard widgets.
-
Added the TopoJSON Javascript library for efficient map-based visualizations on dashboards.
-
Added the 'humanize-duration' Javascript library by Evan Hahn https://github.com/EvanHahn/HumanizeDuration.js (Unlicense/BSD). This converts a number of milliseconds into a human readable duration (e.g. "1 day, 2 hours"). This is much slimmer than using moment.js.