Chart
(Added in 11.0)
In interaction web forms, a chart element renders an interactive data visualization.
start:
  await:
    form:
      title: Chart
      elements:
        chart/prompt_chart:
          label: Tickets by group (past 1 year):
          datasets:
            dataQuery/tickets:
              query@text:
                type:worklist.subtotals
                of:ticket
                by:[created@month,group~20]
                query:(created:"-1 year to now")
                format:timeseries
          schema:
            data:
              type: bar
              series:
                tickets:
                  x_key: ts
              stacks:
                0@csv: tickets
            axis:
              x:
                type: timeseries
                tick:
                  format:
                    date:
                      pattern: %b %Y
                  fit@bool: no
                  multiline@bool: no
                  rotate: -90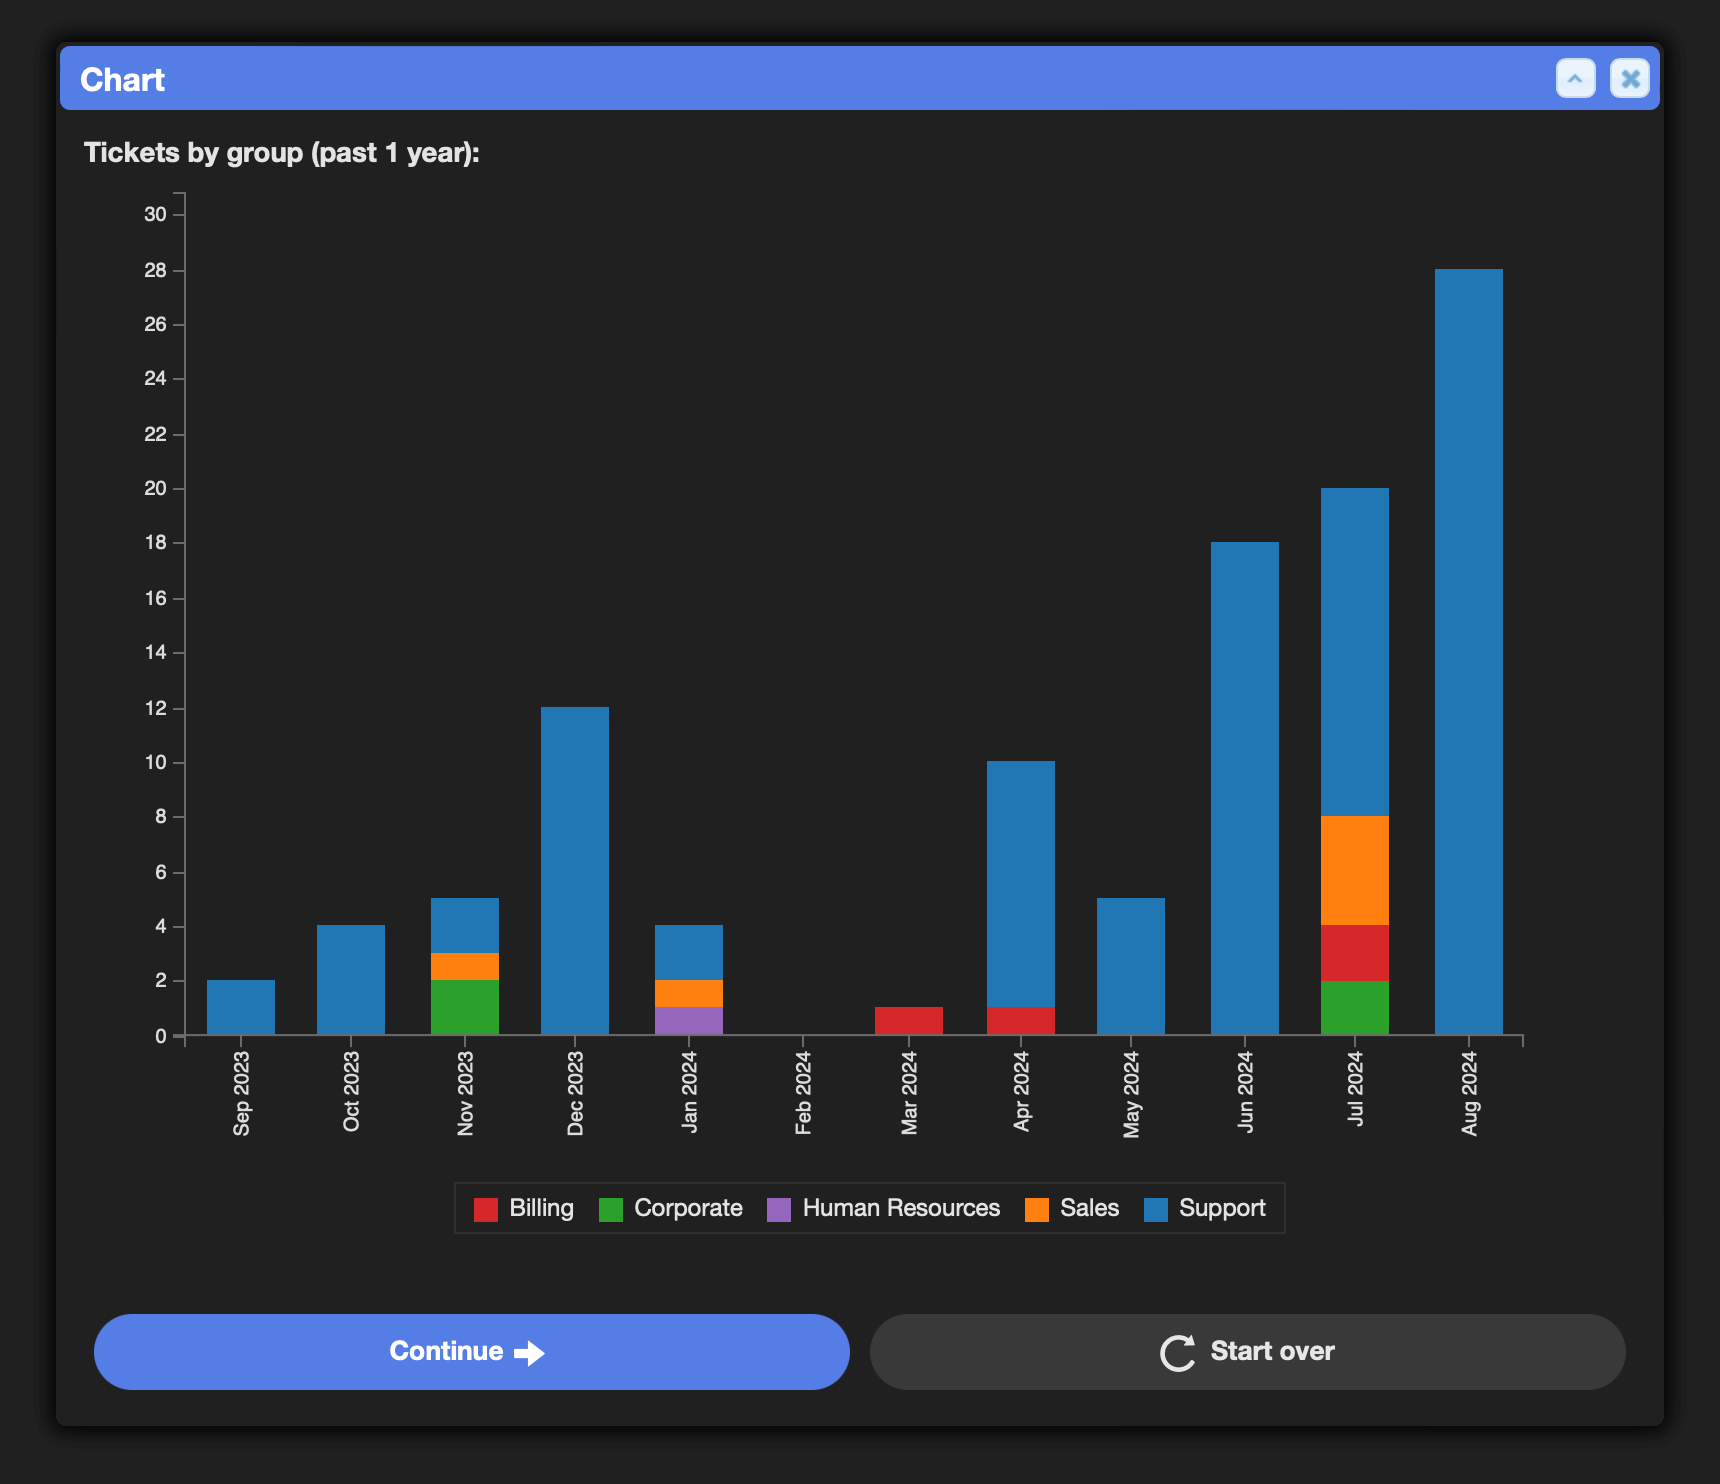
Syntax
label:
The optional label to display above the form element.
datasets:
The datasets to load and pass to the visualization.
| Type |
|---|
automation: |
dataQuery: |
manual: |
hidden:
This form element can be conditionally hidden.
hidden@bool: {{not worker_is_superuser}}schema:
The schema to render.