Sample Data
sample.geo.points
sample.geo.points data queries return simulated GeoJSON data.
Inputs
Each series.* should provide:
name:(human-friendly series name for visualizations)coordinates:(a longitude/latitude coordinate in POINT format)
Response Formats
- geojson (default) returns data in GeoJSON format for map-based visualizations.
Examples
type:sample.geo.points
series.cities:(
  lihue:(name:"Lihue" coordinates:"POINT(-159.342222 21.978611)")
  new_york:(name:"New York" coordinates:"POINT(-73.935242 40.73061)")
  seattle:(name:"Seattle" coordinates:"POINT(-122.350876 47.620499)")
  berlin:(name:"Berlin" coordinates:"POINT(13.393236 52.504043)")
  sydney:(name: "Sydney" coordinates:"POINT(151.21 -33.868)")
)
format:geojson
sample.records
sample.records data queries return simulated dictionary data. For instance, this can be used to mock data in sheets.
Inputs
The records:() key is a collection of arbitrary key/value dictionaries.
Response Formats
- dictionaries (default) returns a table-based format suitable for sheets and API results.
Examples:
-
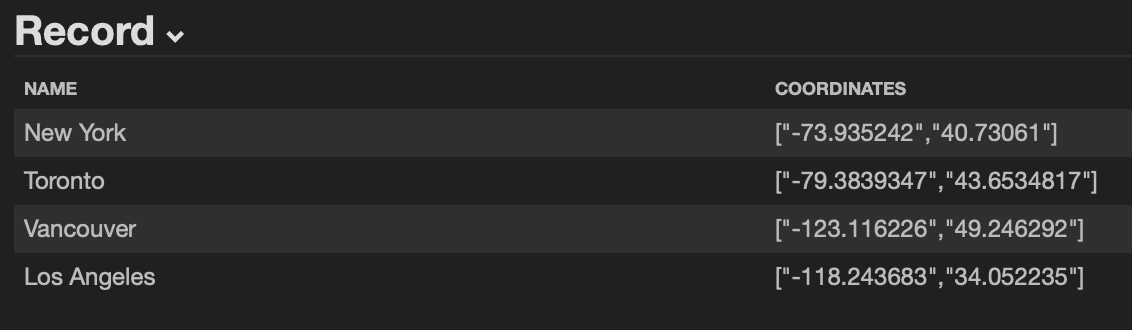
type:sample.records records:( new_york:(name:"New York" coordinates:[-73.935242, 40.73061]) toronto:(name:"Toronto" coordinates:[-79.3839347, 43.6534817]) vancouver:(name:"Vancouver" coordinates:[-123.116226, 49.246292]) los_angeles:(name:"Los Angeles" coordinates:[-118.243683, 34.052235]) ) format:dictionaries -
{
  "data": {
    "new_york": {
      "name": "New York",
      "coordinates": [
        "-73.935242",
        "40.73061"
      ]
    },
    "toronto": {
      "name": "Toronto",
      "coordinates": [
        "-79.3839347",
        "43.6534817"
      ]
    },
    "vancouver": {
      "name": "Vancouver",
      "coordinates": [
        "-123.116226",
        "49.246292"
      ]
    },
    "los_angeles": {
      "name": "Los Angeles",
      "coordinates": [
        "-118.243683",
        "34.052235"
      ]
    }
  },
  "_": {
    "type": "sample.records",
    "format": "dictionaries"
  }
}
sample.timeseries
sample.timeseries data queries return simulated time-series data.
Inputs
Each series.* should provide:
label:(human-friendly series name for visualizations)y.min(the minimum bound for random y-axis data)y.max(the maximum bound for random y-axis data)trend(general trend:down,up,random)
Response Formats
- timeseries (default) returns data in time-series format for visualizations.
Examples
type:sample.timeseries
x.count:10
x.unit:months
series.created_tickets:(
	label:"# Tickets"
	y.min:1000
	y.max:100000
	trend:down
)
series.created_tasks:(
	label:"# Tasks"
	y.min:200
	y.max:30000
	trend:up
)
series.created_calls:(
	label:"# Calls"
	y.min:100
	y.max:10000
	trend:random
)
format:timeseries
sample.xy
sample.xy data queries return simulated X/Y data for scatterplots, etc.
Inputs
Each series.* should provide:
label:(human-friendly series name for visualizations)samples(the number of samples to generate for this series)x.min(the minimum bound for random x-axis data)x.max(the maximum bound for random x-axis data)y.min(the minimum bound for random y-axis data)y.max(the maximum bound for random y-axis data)trend(general trend:down,up,random)
Response Formats
- scatterplot (default) returns data in scatterplot format for visualizations.
Examples
type:sample.xy
series.standard:(
	label:"Standard"
	samples:100
	trend:down
	x.min:120
	x.max:172800
	y.min:0
	y.max:100
)
series.enterprise:(
	label:"Enterprise"
	samples:25
	trend:down
	x.min:120
	x.max:86400
	y.min:0
	y.max:100
)
format:scatterplot