Worklist Metrics
worklist.metrics
worklist.metrics queries return computed metrics based on worklist data (e.g. 'average ticket first response time over the past year').
Inputs
Each values.* series should provide:
label:(human-friendly series name for visualizations)of:(record type)field:(record field using quick search keys)function:(count,min,max,average,sum)metric:(an equation to apply to each value; 9.1.6 or later)query:(the query to filter the results for this series)query.required:(the required query to filter the results for this series)
Optionally, multiple functions can be specified for a series, like functions:[sum,average], and multiple series will be generated automatically using the same record type, field, and query.
Response Formats
-
pie returns data for use in pie and donut charts (as of 9.5.6).
-
table (default) returns tabular output, suitable for display with the 'Chart: Table' visualization widget. Multiple metrics are returned as rows.
Examples
Calculating the average first response time from a worklist of tickets
type:worklist.metrics
values.total:(
  of:ticket
  field:response.first
  function:average
  query:(
    created:"-1 year"
    response.first:>0
  )
)
format:table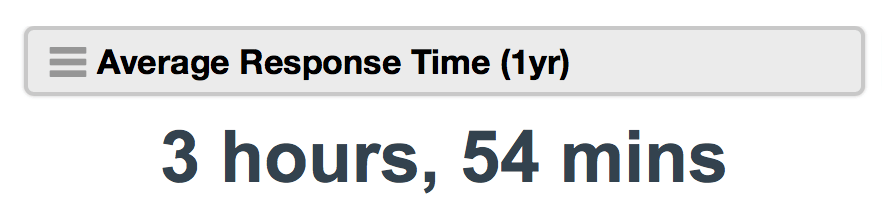
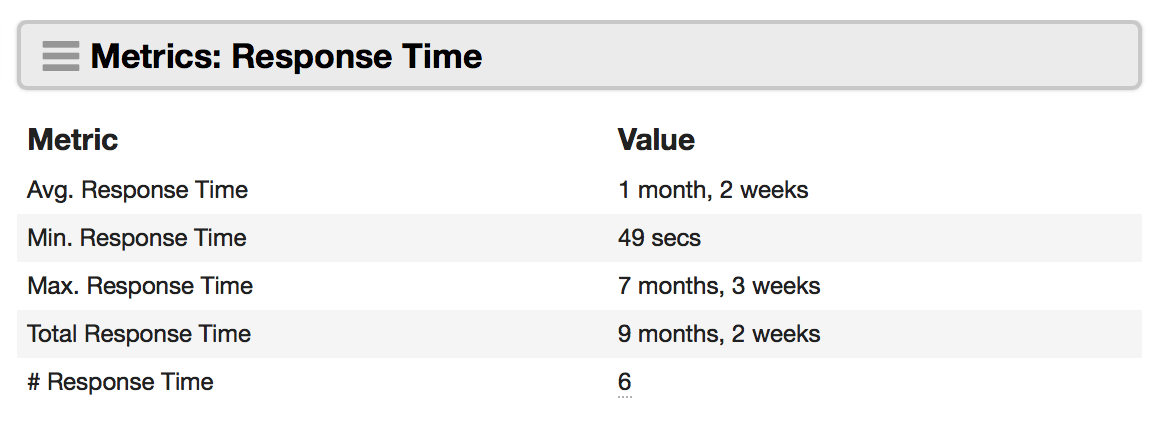
Calculating multiple functions in a single query
type:worklist.metrics
values.response_time:(
  of:message
  functions:[average,min,max,sum,count]
  field:responseTime
  query:(
    worker.id:{{record_id}}
    created:"-1 month"
    isOutgoing:y
    isBroadcast:n
    responseTime:>0
  )
)
format:table