Worklist Series
worklist.series
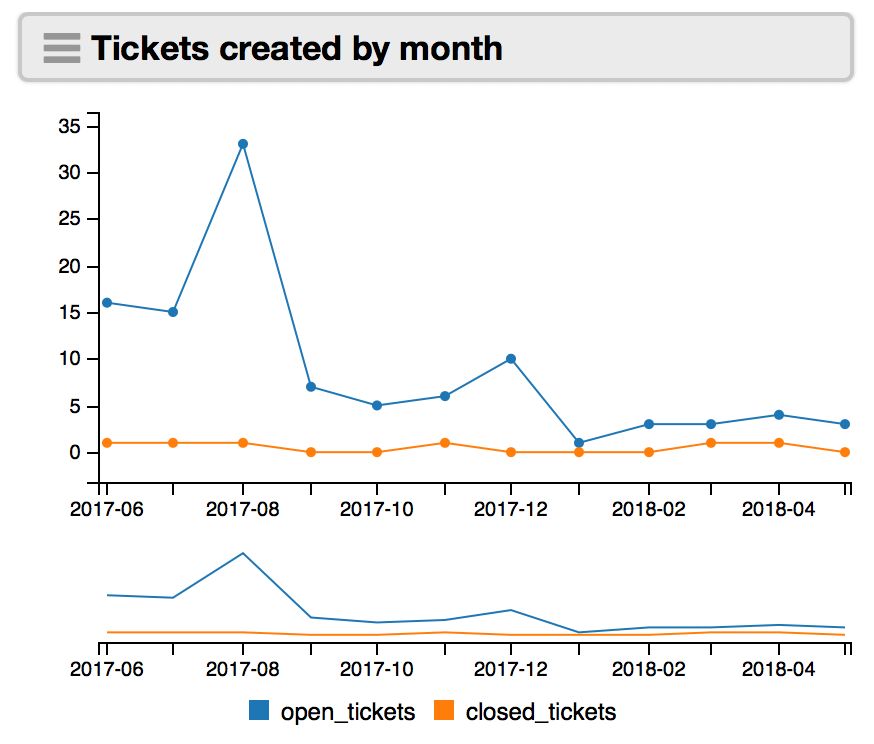
worklist.series data queries return series-based data from any worklist (e.g. tickets created by month by status). Data from multiple series of different record types can be returned in a single query.
Inputs
Each series.* should provide:
label:(human-friendly series name for visualizations)of:(record type)x:(record field for the x-axis using quick search keys)y:(record field for the y-axis using quick search keys)y.metric:(an equation to apply to each y-axis value; 9.1.6 or later)function:(count,min,max,average,sum ony:field)query:(the query to filter the results for this series)query.required:(the required query to filter the results for this series)
By default you'll receive 10 data points per series. You can add a limit:<number> to the query: to change this.
timezone:
(Available in 10.2.0 or later)
The timezone: key generates date labels in the given timezone location for bins like by:[created@day].
An option like timezone:America/Los_Angeles uses the offset UTC-7 or UTC-8 depending on Daylight Saving Time.
If omitted, this defaults to the timezone of the current worker or the server.
Response Formats
-
dictionaries returns data for use in sheets (as of 10.3).
-
pie returns data for use in pie and donut charts (as of 10.2.5).
-
table returns tabular output, suitable for display with the 'Chart: Table' visualization widget.
-
timeseries (default) returns time-based series data, suitable for display with the 'Chart: Time Series' visualization widget.
Examples
Return series data from a worklist
type:worklist.series
series.open_tickets:(
  of:tickets
  x:created@month
  y:id
  function:count
  query:(status:o limit:24)
)
series.closed_tickets:(
  of:tickets
  x:created@month
  y:id
  function:count
  query:(status:c limit:24)
)
format:timeseries