Maps
Create interactive map visualizations with geospatial data
Cerb can create interactive map visualizations with geospatial data from any source using the standard GeoJSON format.
A map schema is defined using KATA, which may include map resources, additional properties to fetch and merge, region colorization, point datasets, point sizing and colorization, labels, click interactions, and more.
- GeoJSON
- Resources
- Maps KATA
- Zooming and panning
- Handling clicks with automations
- Example: COVID-19 cases in the U.S.
- References
GeoJSON
GeoJSON1 is a text format for describing geometric (latitude/longitude) features for use in maps.
Each feature contains geometry to describe its shape, and a list of key/value properties to describe its attributes. This geometry is vector-based, so it can be sharply scaled to any size.
Individual locations, like cities, are represented as points. Perimeters – such as continents, countries, states, roads, buildings, or geofences – are represented as polygons (a sequence of points).
For instance, a GeoJSON document can contain geometry that describes the shape and position of every country. The same document can also include points for populous cities of those countries. Properties can include localized names, population, continent, identifiers, and so on.
Resources
Detailed map data can be several megabytes in size, which would be cumbersome and redundant to include directly in a widget. Instead, map data is stored in reusable resource records. Each resource has a unique name, like map.world.countries or map.country.germany, which map KATA refers to. To improve performance, resources are cached in a client's web browser and automatically updated with changes.
There are three resource types for maps:
| Type | Description |
|---|---|
| Map | Features that describe regions in GeoJSON (e.g. countries, states, counties). These are base maps that other features are drawn on top of. |
| Map Points | Points of interest to display on a base map in GeoJSON (e.g. cities, business locations). |
| Map Properties | Additional JSON datasets (that can be merged into a base map (e.g. election results by state/county, COVID-19 cases per country). |
Cerb includes several default resources that can be remixed into thousands of combinations:
| Name | Description |
|---|---|
map.world.countries |
The countries of the world |
map.country.usa.states |
The states of the United States |
map.country.usa.counties |
The counties of the United States |
mapPoints.worldCapitalCities |
The capital city for every country |
mapPoints.usaStateCapitals |
The capital city of each U.S. state |
Resources can be file-based, with an uploaded file that infrequently changes, or automation-based, with a dynamically generated resource. For instance, an automation-based resource can fetch live data from any HTTP endpoint, transform it, and output the expected JSON format.
One map resource can form the basis of numerous visualizations. You can have hundreds of map widget variations, and a client's browser will only fetch the distinct resources once.
With map KATA, you can filter the map.world.countries resource to only display a single continent (e.g. Europe), a single country (e.g. Germany), or any combination of countries.
Similarly, the map.country.usa.counties resource can be filtered to display the counties of a single state or region. This one resource replaces 50+ individual U.S. state maps.
These are just the built-in examples. The same approach can be used to create resources for any map, of any region, at any level of detail.
Typically, you would download a "shapefile" from a government agency and convert it to the GeoJSON format, with a tool like shp2json.
However, if you just need a state/province level map for any country, we've already done that work for you in the cerb/geojson-maps repository. Countries are organized by their two-letter code (iso_a2). The repository also includes data sets for populated cities by country or continent. This is much more detail than provided in the default resources.
These resources are derived from Natural Earth public domain data. They do not require attribution and do not have any limitations on their usage.
Maps KATA
As mentioned earlier, map schemas use KATA, our human-friendly text format for structured data.
Resource:
A map starts with a map:resource::
map:
  resource:
    uri: cerb:resource:map.country.usa.states
Notice that the resource is referred to by a map:resource:uri: (uniform resource identifier). This always starts with a cerb: prefix, then a record type, another colon :, and ends with the unique identifier for a record of that type (an alias or record ID).
In the map editor, you can hold Command (Mac) or Control (Windows/Linux) to click on a resource URI and open its card popup.
Projection:
Our planet is spherical, but you're probably used to looking at flat, rectangular maps.
A projection converts geospatial coordinates (latitude/longitude) into a flat plane (2D screen coordinates).
type:
Cerb supports the following projection types:
mercator
Mercator has been the general purpose standard projection for nearly 500 years.
map:
  projection:
    type: mercator
    scale: 90
naturalEarth
Natural Earth is a relatively new projection, suitable for showing worldwide maps at a small scale.
map:
  projection:
    type: naturalEarth
    scale: 90
albersUsa
AlbersUSA is a "composite" projection for displaying a more compact map of the United States, with resized Alaska/Hawaii moved near the continental southwest.
map:
  projection:
    type: albersUsa
    scale: 650
scale:
The map:projection:scale: key determines the initial size of the rendered map features. A larger number results in bigger shapes.
You can determine the ideal scale by panning and zooming the map, then looking at the current values in the bottom right.
map:
  projection:
    type: mercator
    scale: 90
center:
The map:projection:center: key determines the default location at the center of the map's viewport. If omitted, the default is 0º Latitude, 0º Longitude (off the west coast of Africa).
map:
  projection:
    type: mercator
    scale: 90
    center:
        latitude: 0
        longitude: 0
The albersUsa projection does not support this option, and is instead always centered on the United States by default. You can use zoom: to change the focus.
zoom:
While map:projection:center: determines the baseline map position, the map:projection:zoom: key allows you to procedurally pan and zoom the map. These changes can be reset back to the baseline by the user.
Interactions can also use the zoom: option to move around an existing map.
map:
  projection:
    type: mercator
    scale: 90
    center:
        latitude: 0
        longitude: 0
    zoom:
        latitude: 37.98
        longitude: -97.74
        scale: 2
The map:projection:zoom:scale: key is a zoom multiplier from 1 to 40.
Regions:
The shapes in the base map are regions – countries, states, etc.
When you click on a region on the map, you'll see a list of its key/value properties in the top left.
This makes it easy to explore the available properties while creating your map.
properties:
To improve reusability, you can use map:regions:properties: to merge additional properties into the existing regions on a map.
data:
Use the map:regions:properties:data: key to specify additional properties to merge into the existing map regions.
map:
  resource:
    uri: cerb:resource:map.country.usa.states
  projection:
    type: albersUsa
    scale: 650
  regions:
    properties:
      data:
        CA:
          party: D
        TX:
          party: R
      join:
        property: postal
        case: upper
resource:
Use the map:regions:properties:resource: key to fetch a 'Map Properties' resource and merge it into the existing map regions.
map:
  resource:
    uri: cerb:resource:map.country.usa.states
  projection:
    type: albersUsa
    scale: 650
  regions:
    properties:
      resource:
        uri: cerb:resource:mapProperties.usaStateAnimals
      join:
        property: name
        case: upper
The map properties resource must have the following JSON object format:
{
    "VALUE_TO_MATCH": {
        "new_property": "some value",
        "another_new_property": "another value"
    },
    ...
}
For instance:
{
    "CALIFORNIA": {
        "state_animal": "California grizzly bear"
    },
    "TEXAS": {
        "state_animal": "Nine-banded armadillo"
    }
}
join:
The top-level keys should uniquely identify a property of the base map (e.g. country/state). This is referenced in the map:regions:properties:join:property: key.
The join property must exactly match an existing property for each feature. You can use the map:regions:properties:join:case: key with a value of upper (upper case) or lower (lower case) to normalize the data. For instance, case: upper will match camelCaps using CAMELCAPS for both the join property and the feature property.
With this option you can join countless datasets to an existing map.
It's a good idea to use standard properties like iso_a2 to join properties to your map. These are already uniform and used by many third-party datasets.
label:
It's useful to be able to see all of the properties on a feature when designing your map. However, you'll likely eventually want to display only the data related to your visualization.
You can use the map:regions:label: key to control the contents of the floating label.
map:
  resource:
    uri: cerb:resource:map.country.usa.states
  projection:
    type: albersUsa
    scale: 650
  regions:
    properties:
      resource:
        uri: cerb:resource:mapProperties.usaStateAnimals
      join:
        property: name
        case: upper
    label:
      title: name
      properties:
        state_animal:
          label: Animal
        pop_est:
          label: Population
          format: number
filter:
Use map:regions:filter: to extract or omit certain features from a larger map resource.
is:
Use is: to match a single property value:
map:
  resource:
    uri: cerb:resource:map.country.usa.states
  projection:
    type: albersUsa
    scale: 650
  regions:
    filter:
      property: name
      is: California
is@list:
Use is@list: or is@csv: to match multiple values in a single property:
map:
  resource:
    uri: cerb:resource:map.world.countries
  projection:
    type: mercator
    scale: 790
    center:
      latitude: 48.4088
      longitude: 8.2271
  regions:
    filter:
      property: name
      is@list:
        Austria
        Belgium
        France
        Germany
        Switzerland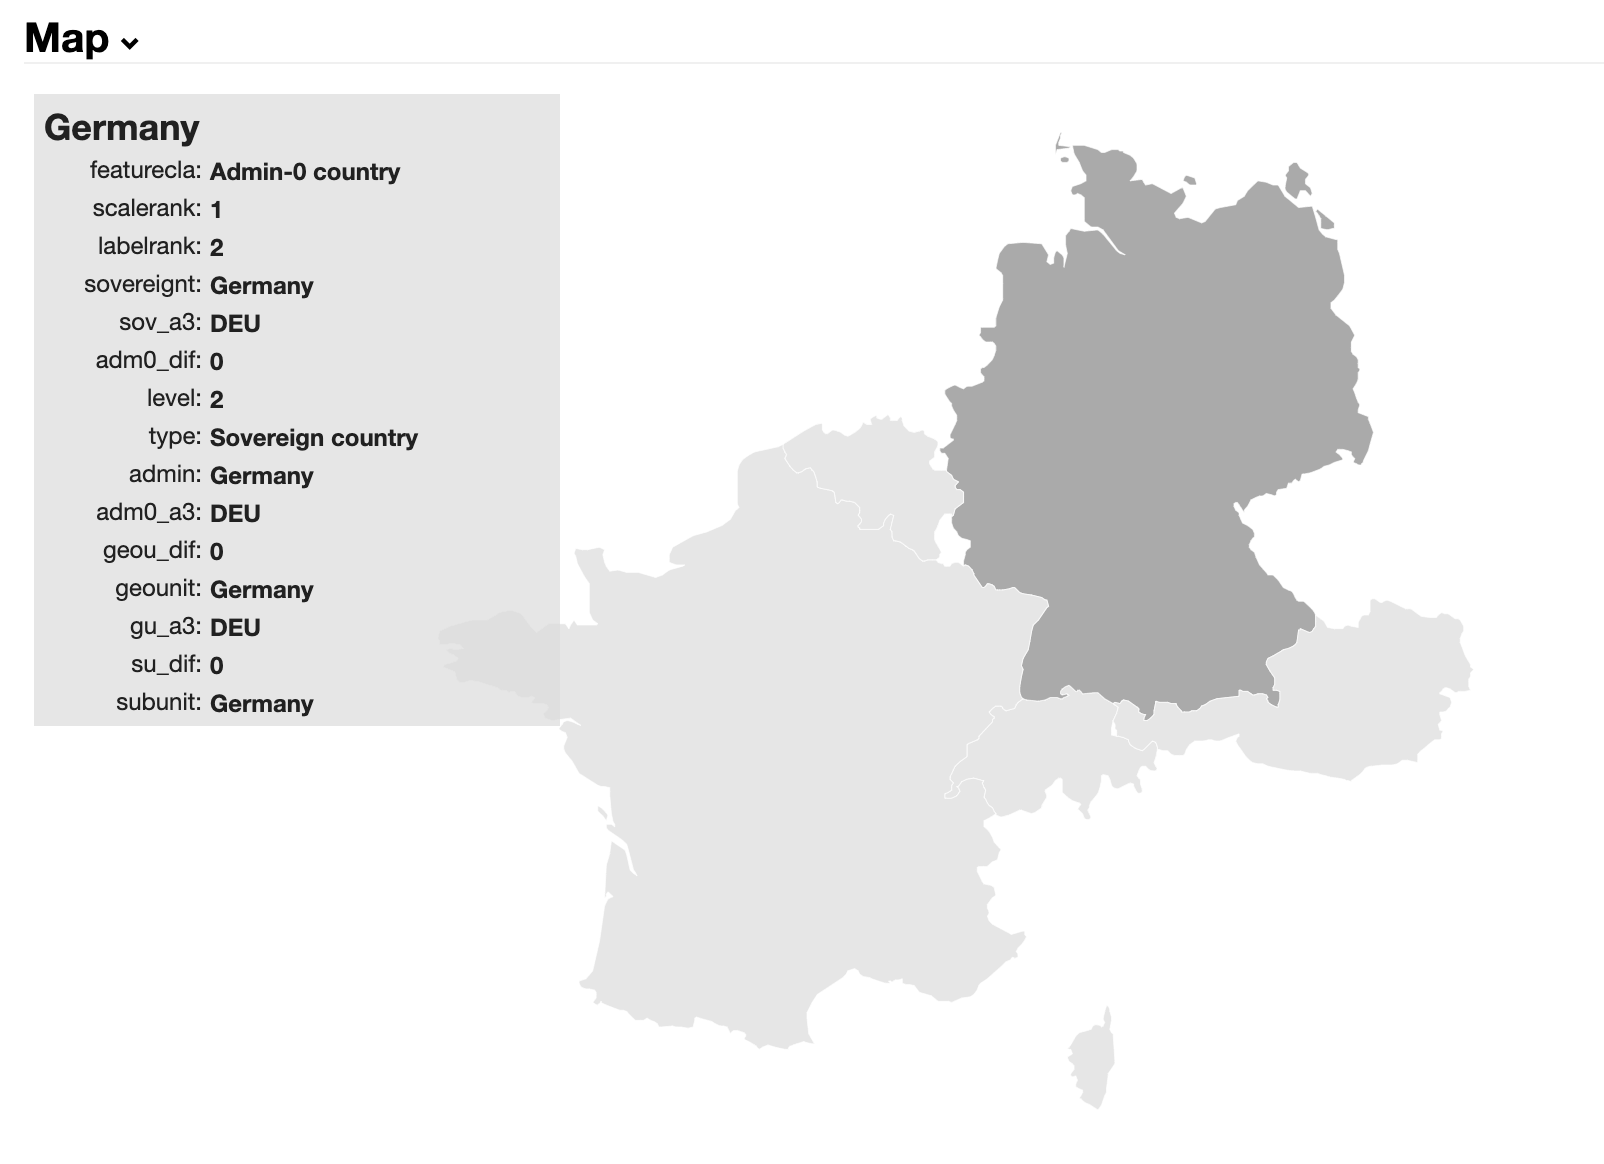
not:
Use not: to exclude a single property value:
map:
  resource:
    uri: cerb:resource:map.world.countries
  projection:
    type: mercator
    scale: 90
    center:
      latitude: 0
      longitude: 0
  regions:
    filter:
      property: continent
      not: North America
not@list:
Use not@list: or not@csv: to exclude multiple values in a single property:
map:
  resource:
    uri: cerb:resource:map.world.countries
  projection:
    type: mercator
    scale: 90
    center:
      latitude: 0
      longitude: 0
  regions:
    filter:
      property: name
      not@csv: Australia, New Zealand, Antarctica
fill:
Map regions can be dynamically colorized based on property values.
Colors should be specified using web colors (CSS) syntax:
| Type | Examples |
|---|---|
| Color names | aquamarine, red, black |
| Hexadecimal | #FF0000, #646464 |
| RGB triplets | rgb(255,0,0), rgba(0,200,0,0.5) |
color_key:
Use map:regions:fill:color_key: to select colors directly from a property.
map:
  regions:
    fill:
      color_key:
        property: country_color
color_map:
Use map:regions:fill:color_map: to associate colors with specific property values.
map:
  regions:
    fill:
      color_map:
        property: scalerank
        colors:
          1: gray
          2: blue
          3: green
          4: orange
          5: red
choropleth:
Use map:regions:fill:choropleth: to interpolate color intensity on a scale based on a numeric property.
map:
  regions:
    fill:
      choropleth:
        property: mapcolor9
        classes: 9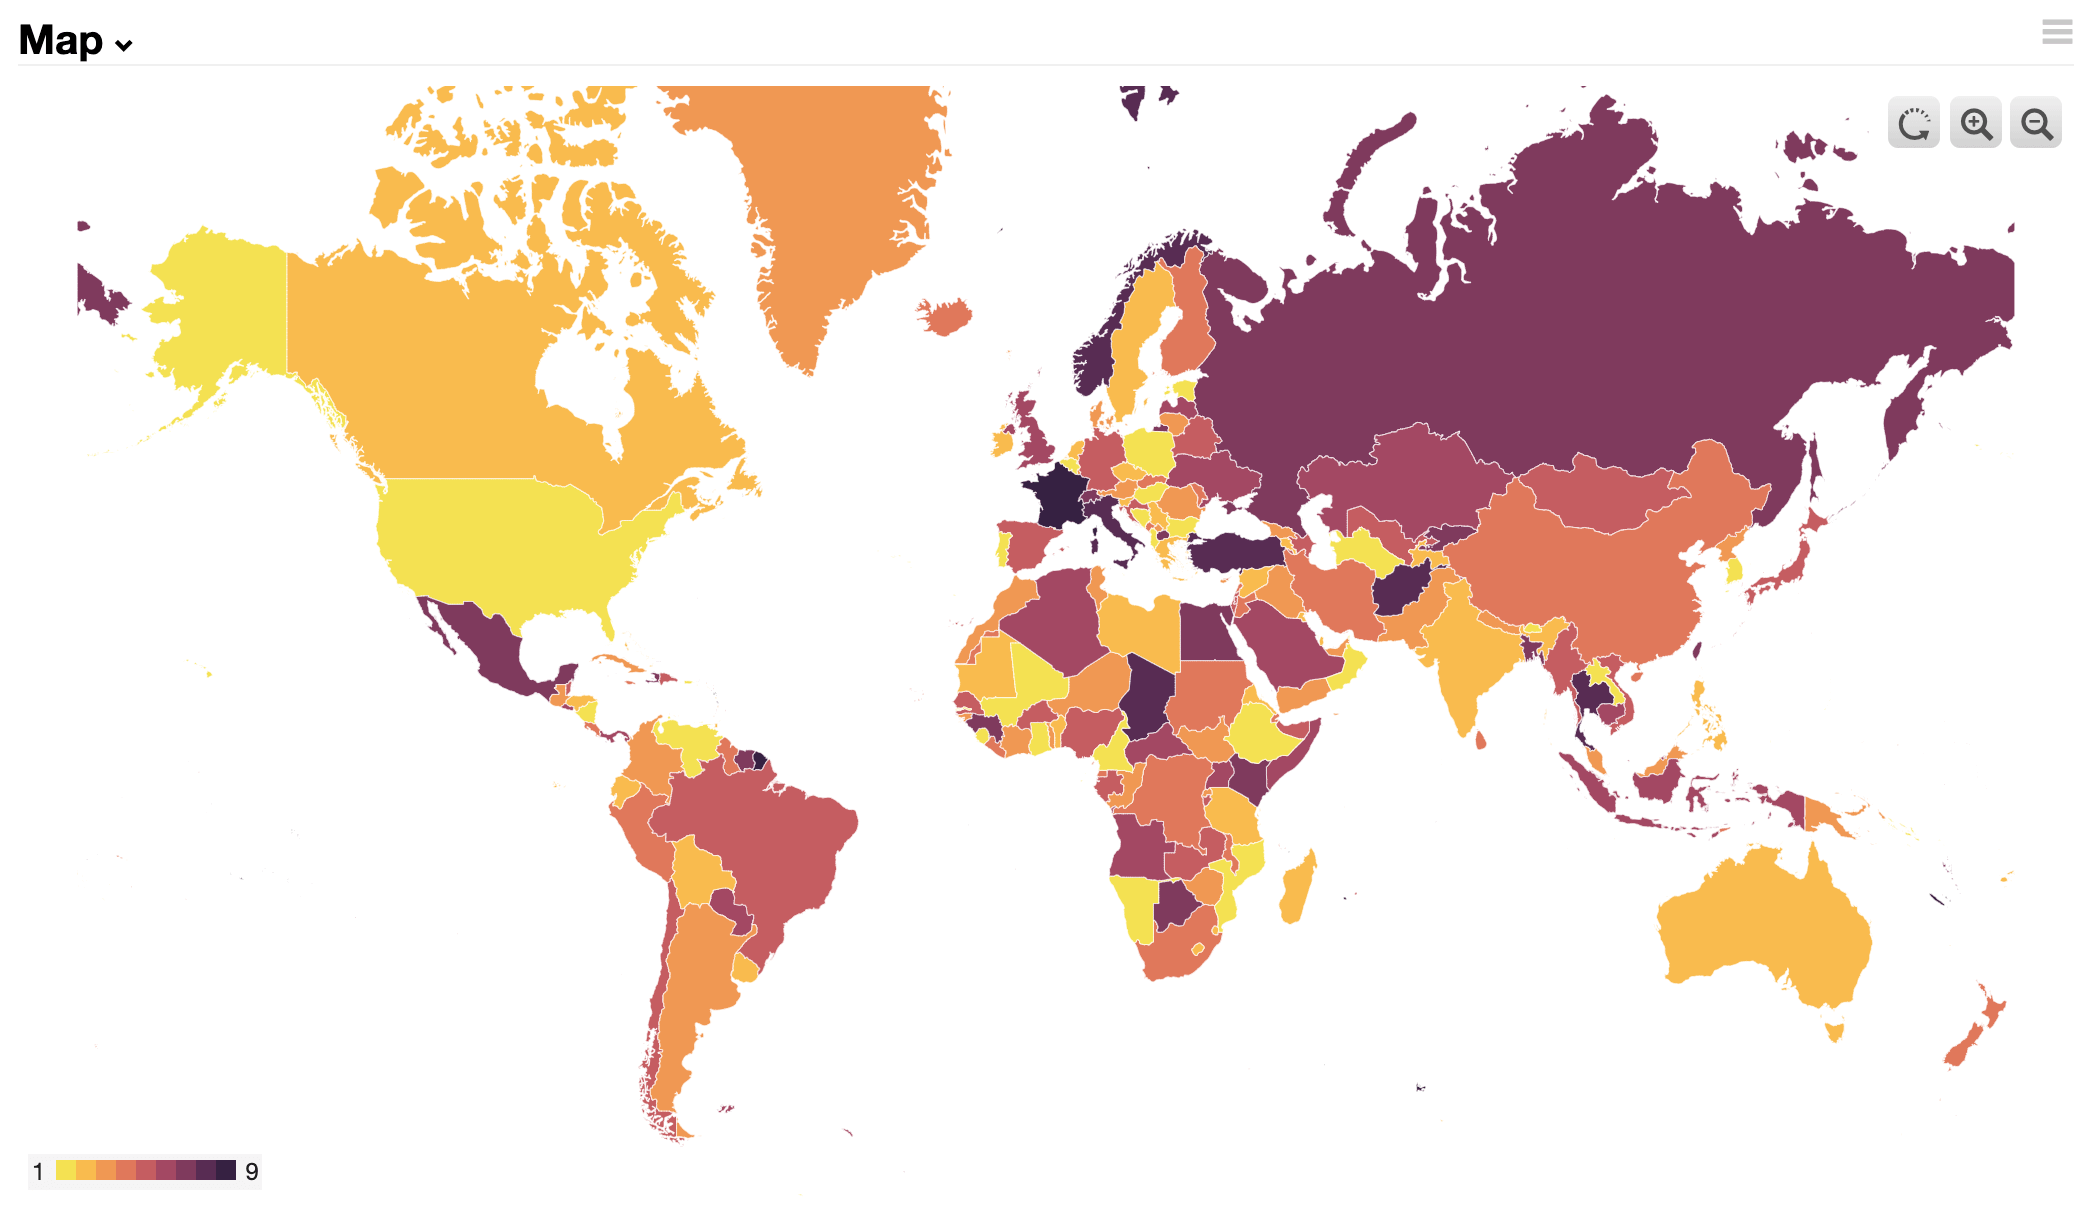
Points:
Points of interest can be plotted on a map using geospatial coordinates (latitude/longitude).
resource:
Like map data, points can be loaded from a resource URI using map:points:resource::
map:
  points:
    resource:
      uri: cerb:resource:mapPoints.worldCapitalCities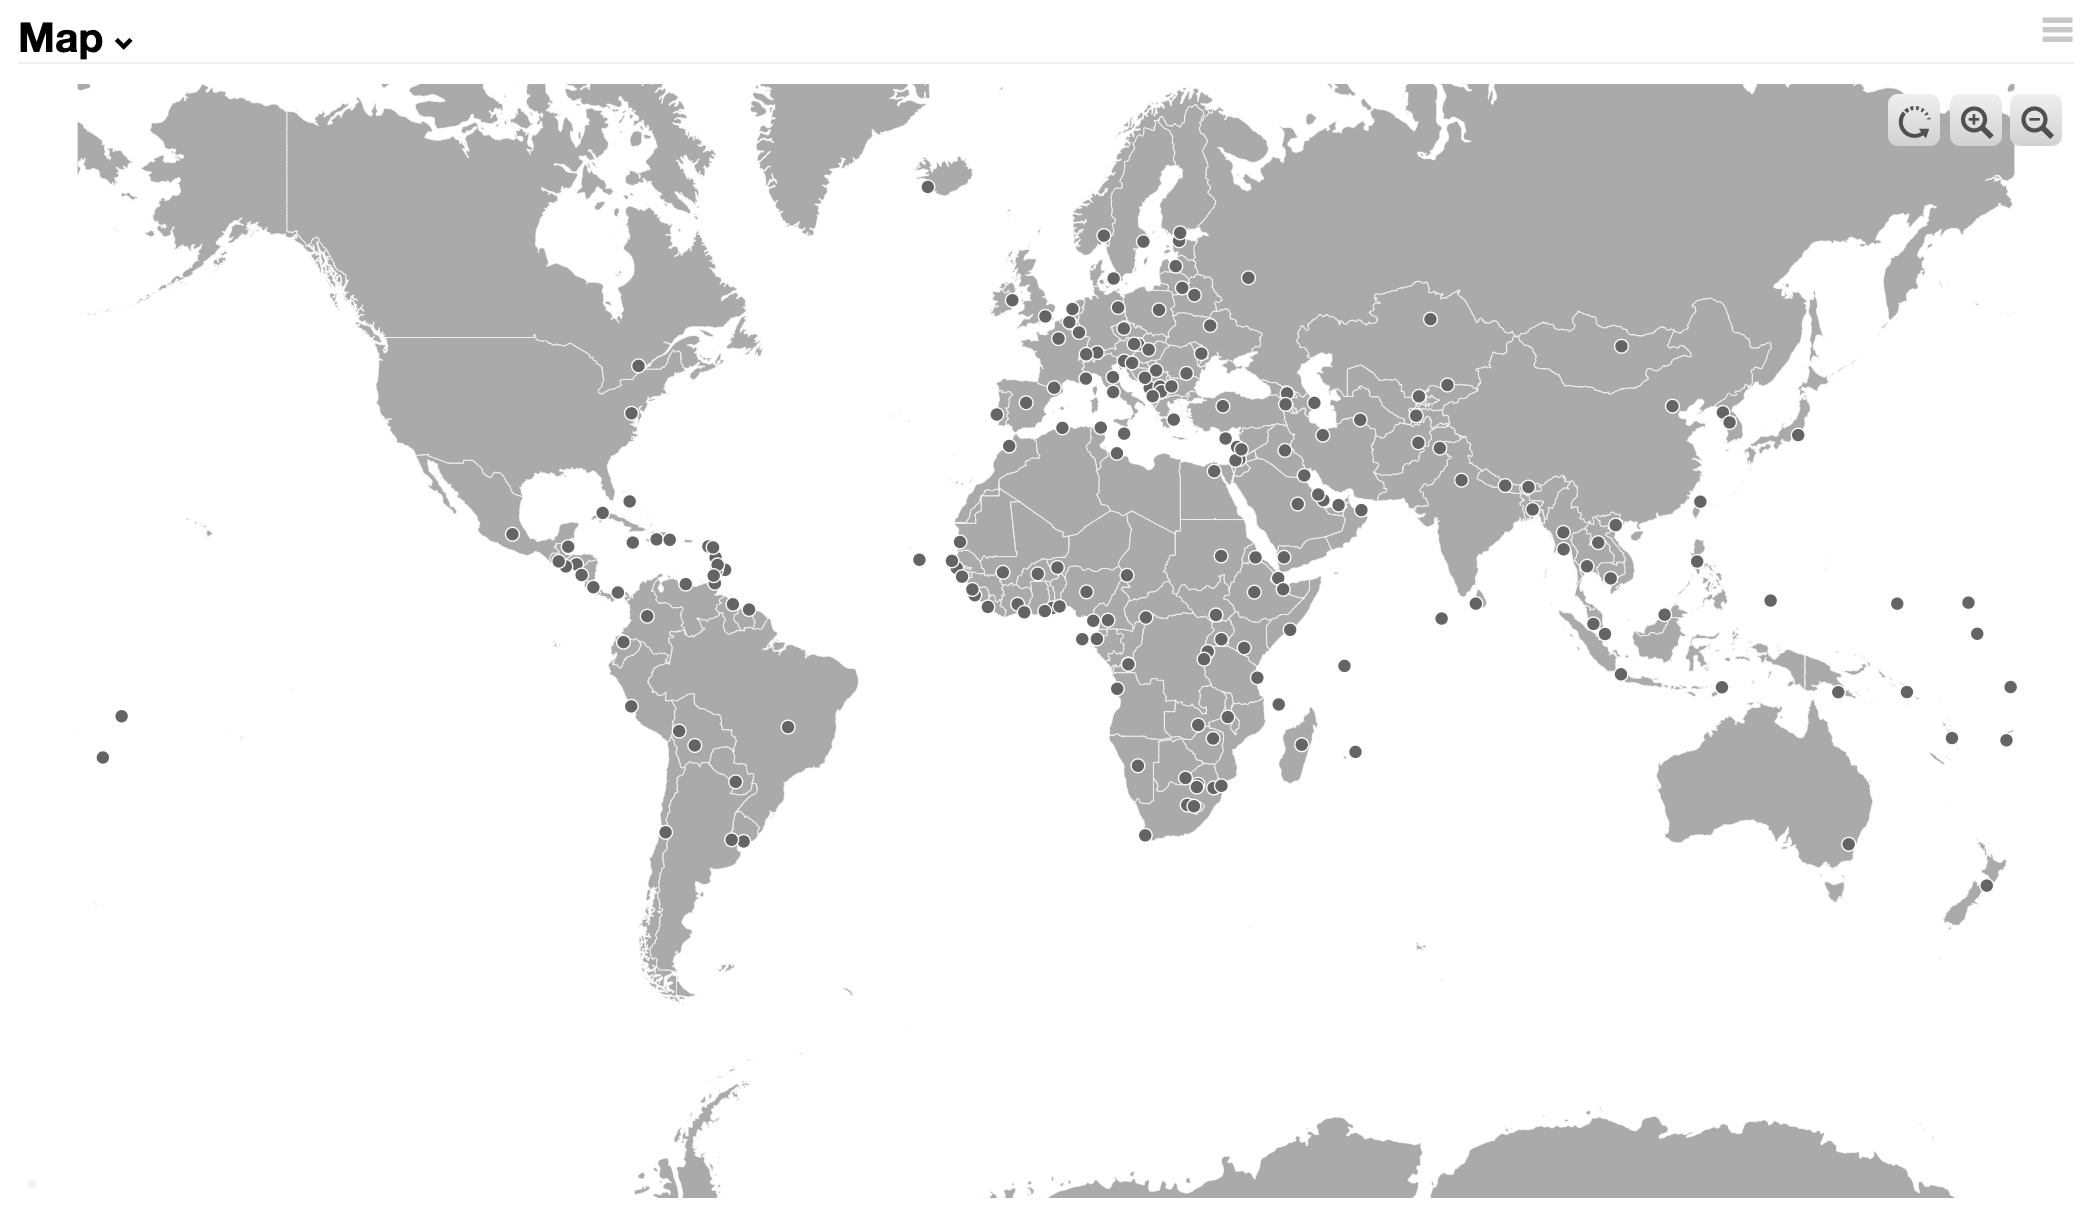
data:
You can also use map:points:data: to manually specify points and their properties. This is useful for map widgets; for instance, displaying an organization's location on its profile page, or displaying the approximate location of an IP address from an interaction.
If you specify both map:points:resource: and map:points:data:, the points will be merged into a single dataset.
map:
  points:
    data:
      point/berlin:
        latitude: 52.549636074382285
        longitude: 13.403320312499998
        properties:
          name: Berlin
          country: Germany
          continent: Europe
      point/los_angeles:
        latitude: 34.08906131584994
        longitude: 241.69921874999997
        properties:
          name: Los Angeles
          country: United States of America
          continent: North America
      point/sydney:
        latitude: -33.7243396617476
        longitude: 151.259765625
        properties:
          name: Sydney
          country: Australia
          continent: Oceania
The website http://geojson.io/ is very useful for finding point coordinates, or drawing simple shapes in GeoJSON.
label:
Like with regions, clicking on a point displays its properties. You can use map:points:label: to select which properties to show.
map:
  points:
    resource:
      uri: cerb:resource:mapPoints.worldCapitalCities
    label:
      title: name
      properties:
        adm1name:
          label: State
        adm0name:
          label: Country
        pop_max:
          label: Population
          format: number
        latitude:
          label: Latitude
        longitude:
          label: Longitude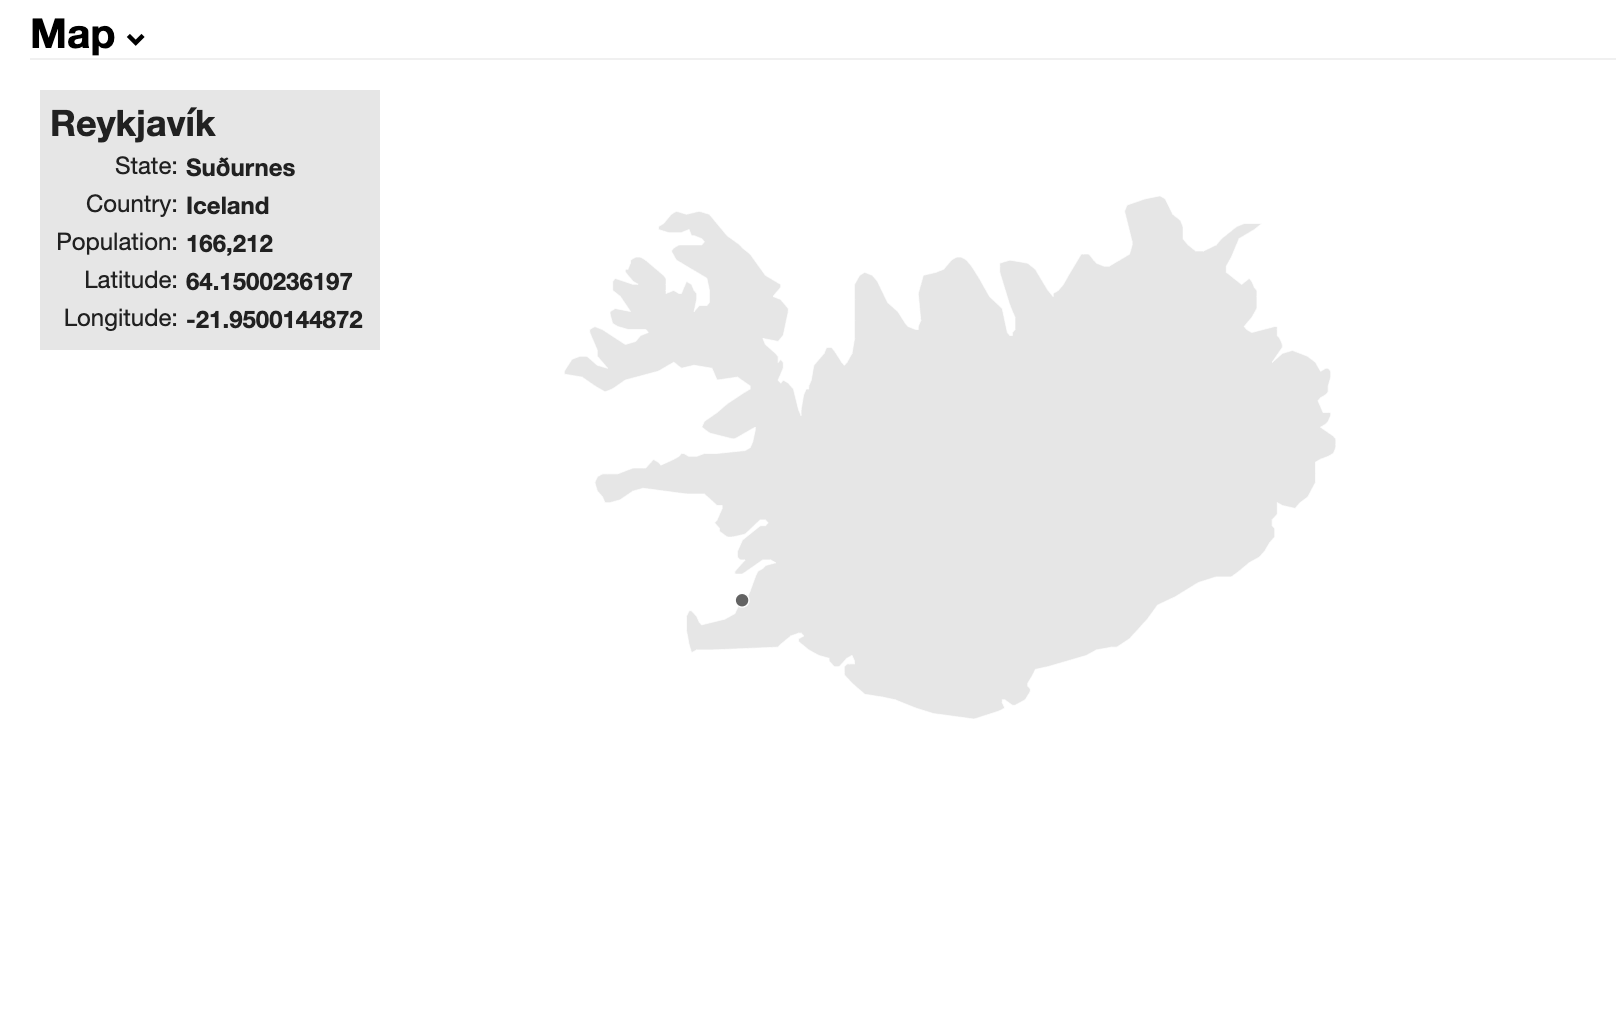
filter:
Use map:points:filter: to extract or omit certain points from a resource.
is:
Use is: to match a single property value:
map:
  points:
    resource:
      uri: cerb:resource:mapPoints.worldCapitalCities
    filter:
      property: continent
      is: Europe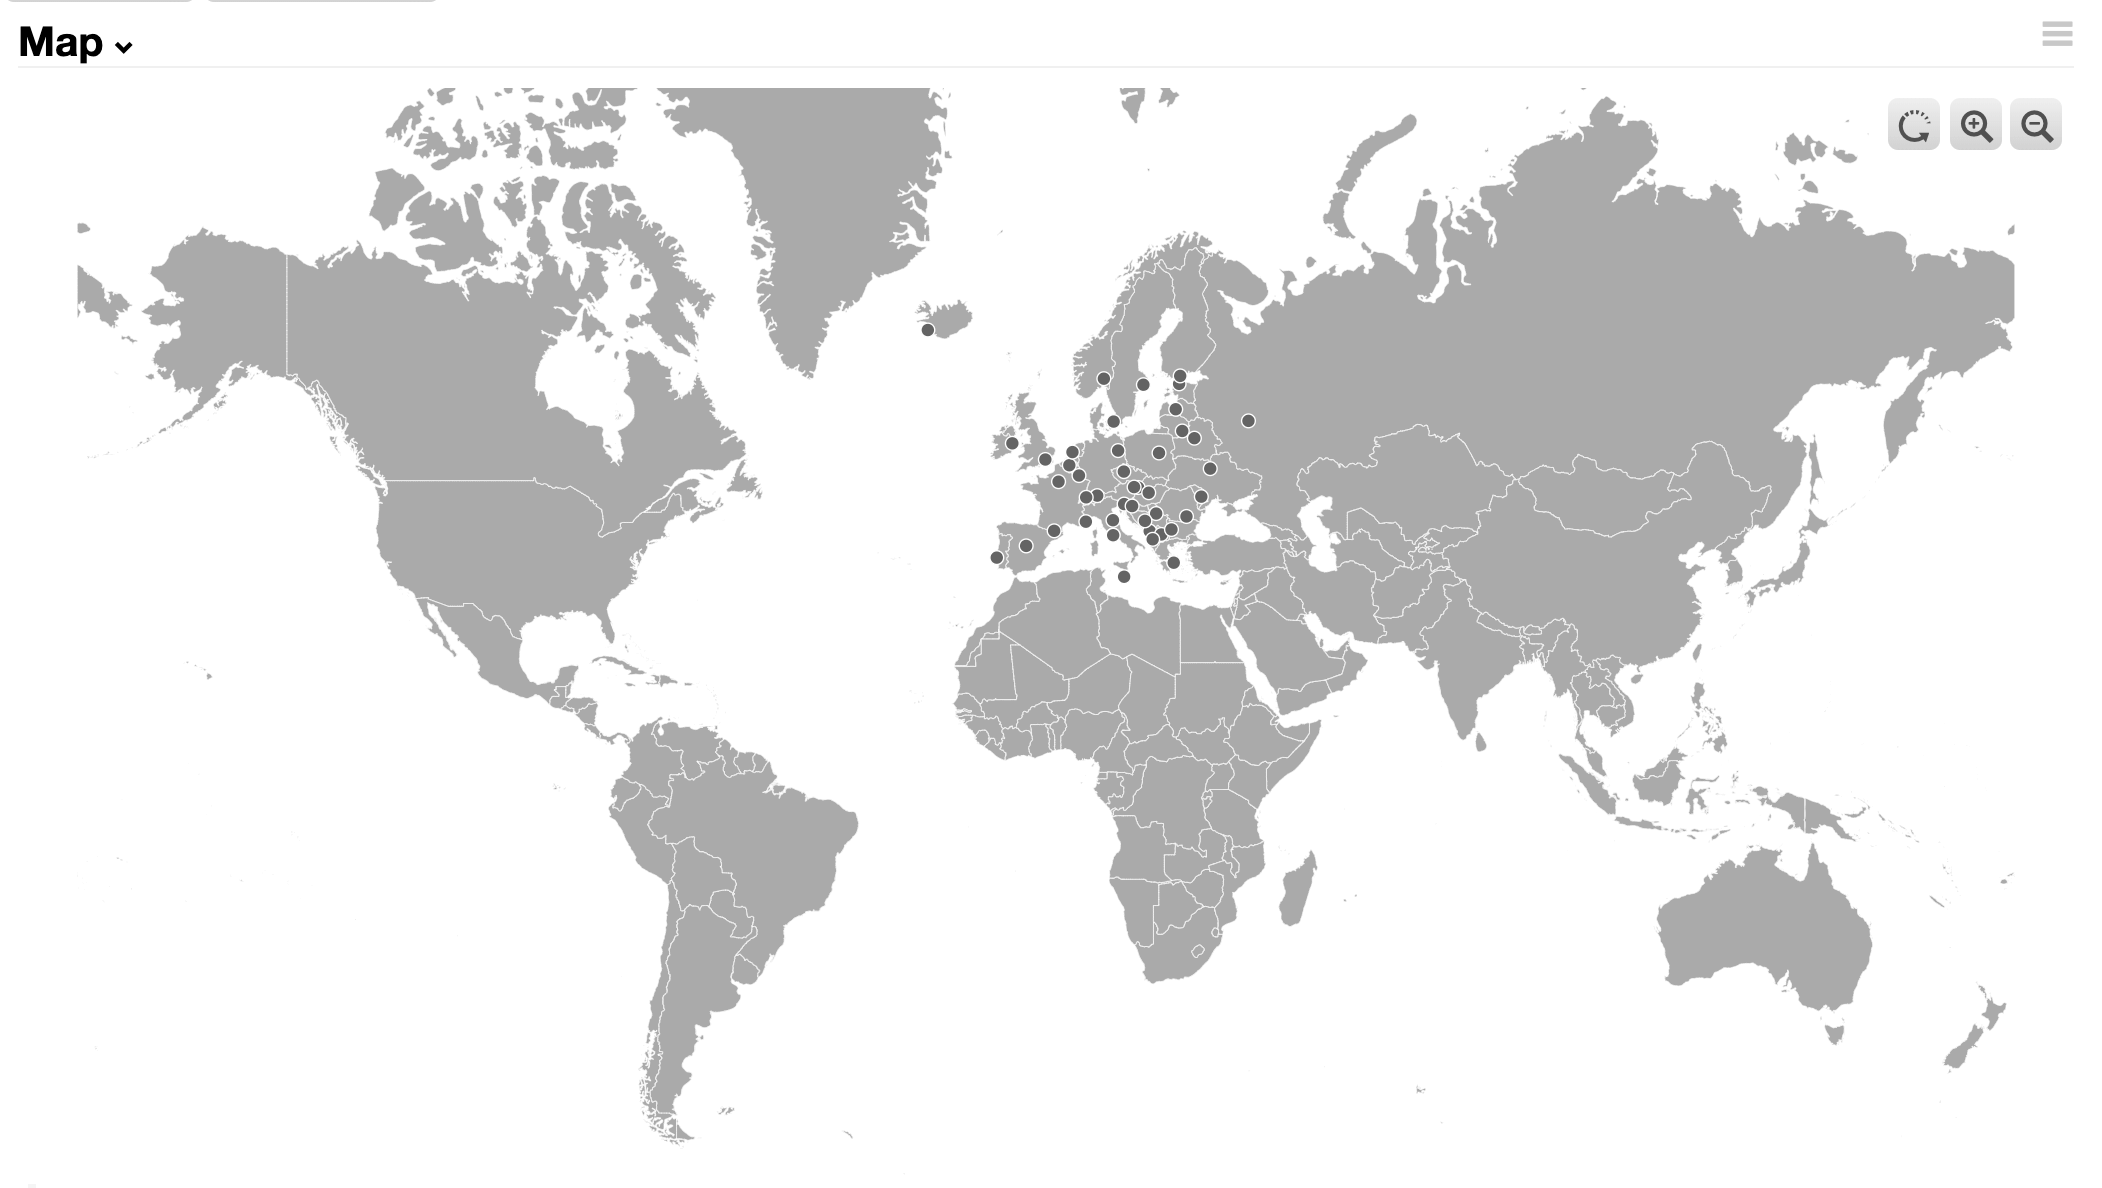
is@list:
Use is@list: or is@csv: to match multiple values in a single property:
map:
  points:
    resource:
      uri: cerb:resource:mapPoints.worldCapitalCities
    filter:
      property: name
      is@list:
        Beijing
        Berlin
        London
        Moscow
        Washington, D.C.
not:
Use not: to exclude a single property value:
map:
  points:
    resource:
      uri: cerb:resource:mapPoints.worldCapitalCities
    filter:
      property: megacity
      not: 0
not@list:
Use not@list: or not@csv: to exclude multiple values in a single property:
map:
  points:
    resource:
      uri: cerb:resource:mapPoints.worldCapitalCities
    filter:
      property: continent
      not@list:
        Asia
        Oceania
size:
Use map:points:size: to configure the size of each point.
default:
The map:points:size:default: key configures the default size for points which don't match any other rules. The size should be specified as a number.
map:
  points:
    resource:
      uri: cerb:resource:mapPoints.worldCapitalCities
    size:
      default: 2.5
value_map:
Use map:points:size:value_map: to associate point sizes based on the value of a property.
map:
  points:
    resource:
      uri: cerb:resource:mapPoints.worldCapitalCities
    size:
      default: 2.5
      value_map:
        property: worldcity
        values:
          1: 5.0
fill:
Use the map:points:fill: key to configure the color for each point.
Colors should be specified using web colors (CSS) syntax:
| Type | Examples |
|---|---|
| Color names | aquamarine, red, black |
| Hexadecimal | #FF0000, #646464 |
| RGB triplets | rgb(255,0,0), rgba(0,200,0,0.5) |
default:
The map:points:fill:default: key configures the default color for points which don't match any other rules.
map:
  points:
    resource:
      uri: cerb:resource:mapPoints.worldCapitalCities
    fill:
      default: red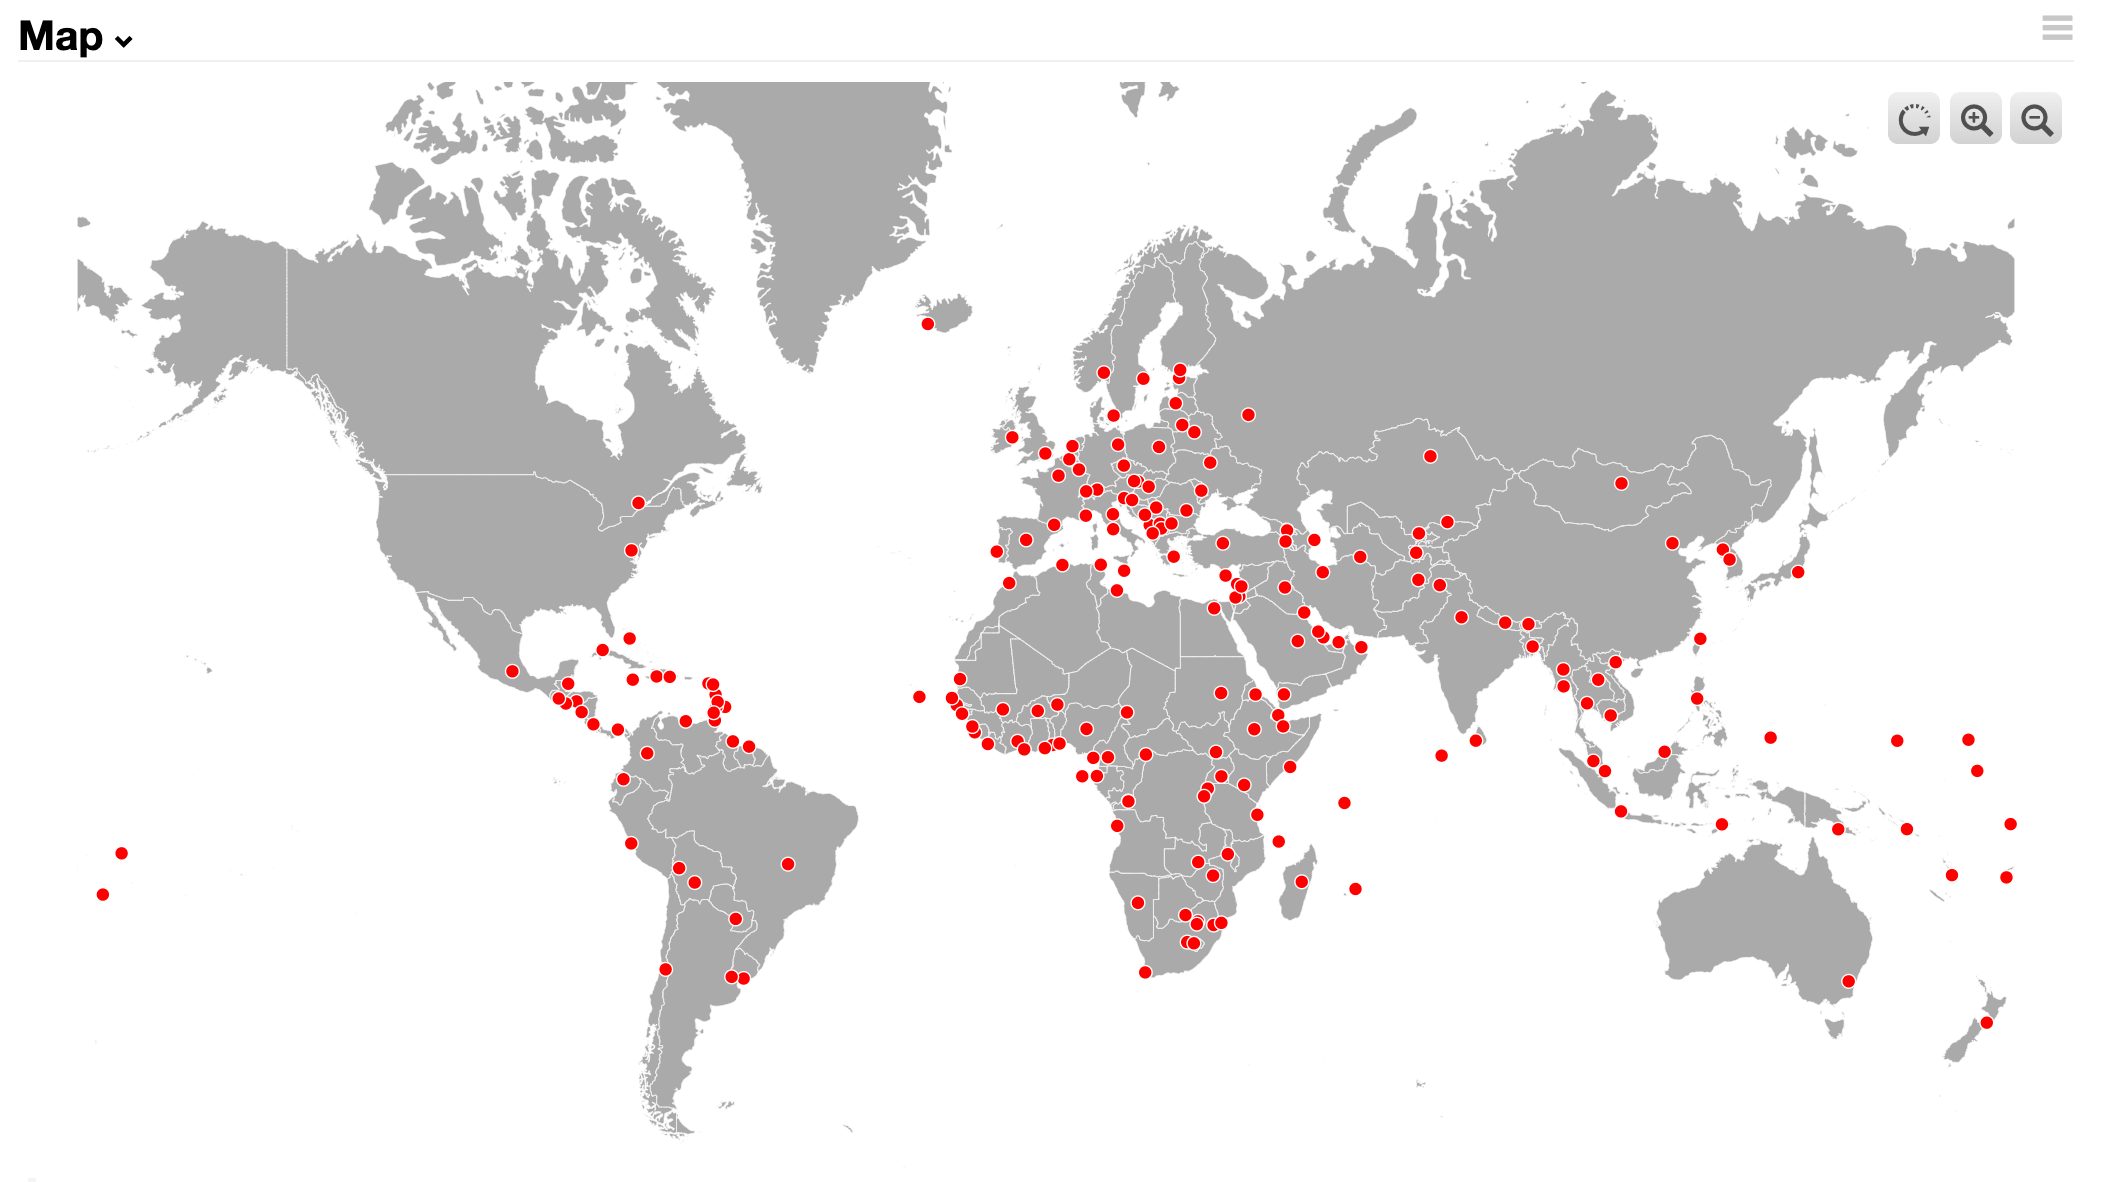
color_map:
Use map:points:fill:color_map: to colorize points based on the value of a property.
map:
  points:
    resource:
      uri: cerb:resource:mapPoints.worldCapitalCities
    fill:
      default: #646464
      color_map:
        property: worldcity
        colors:
          1: red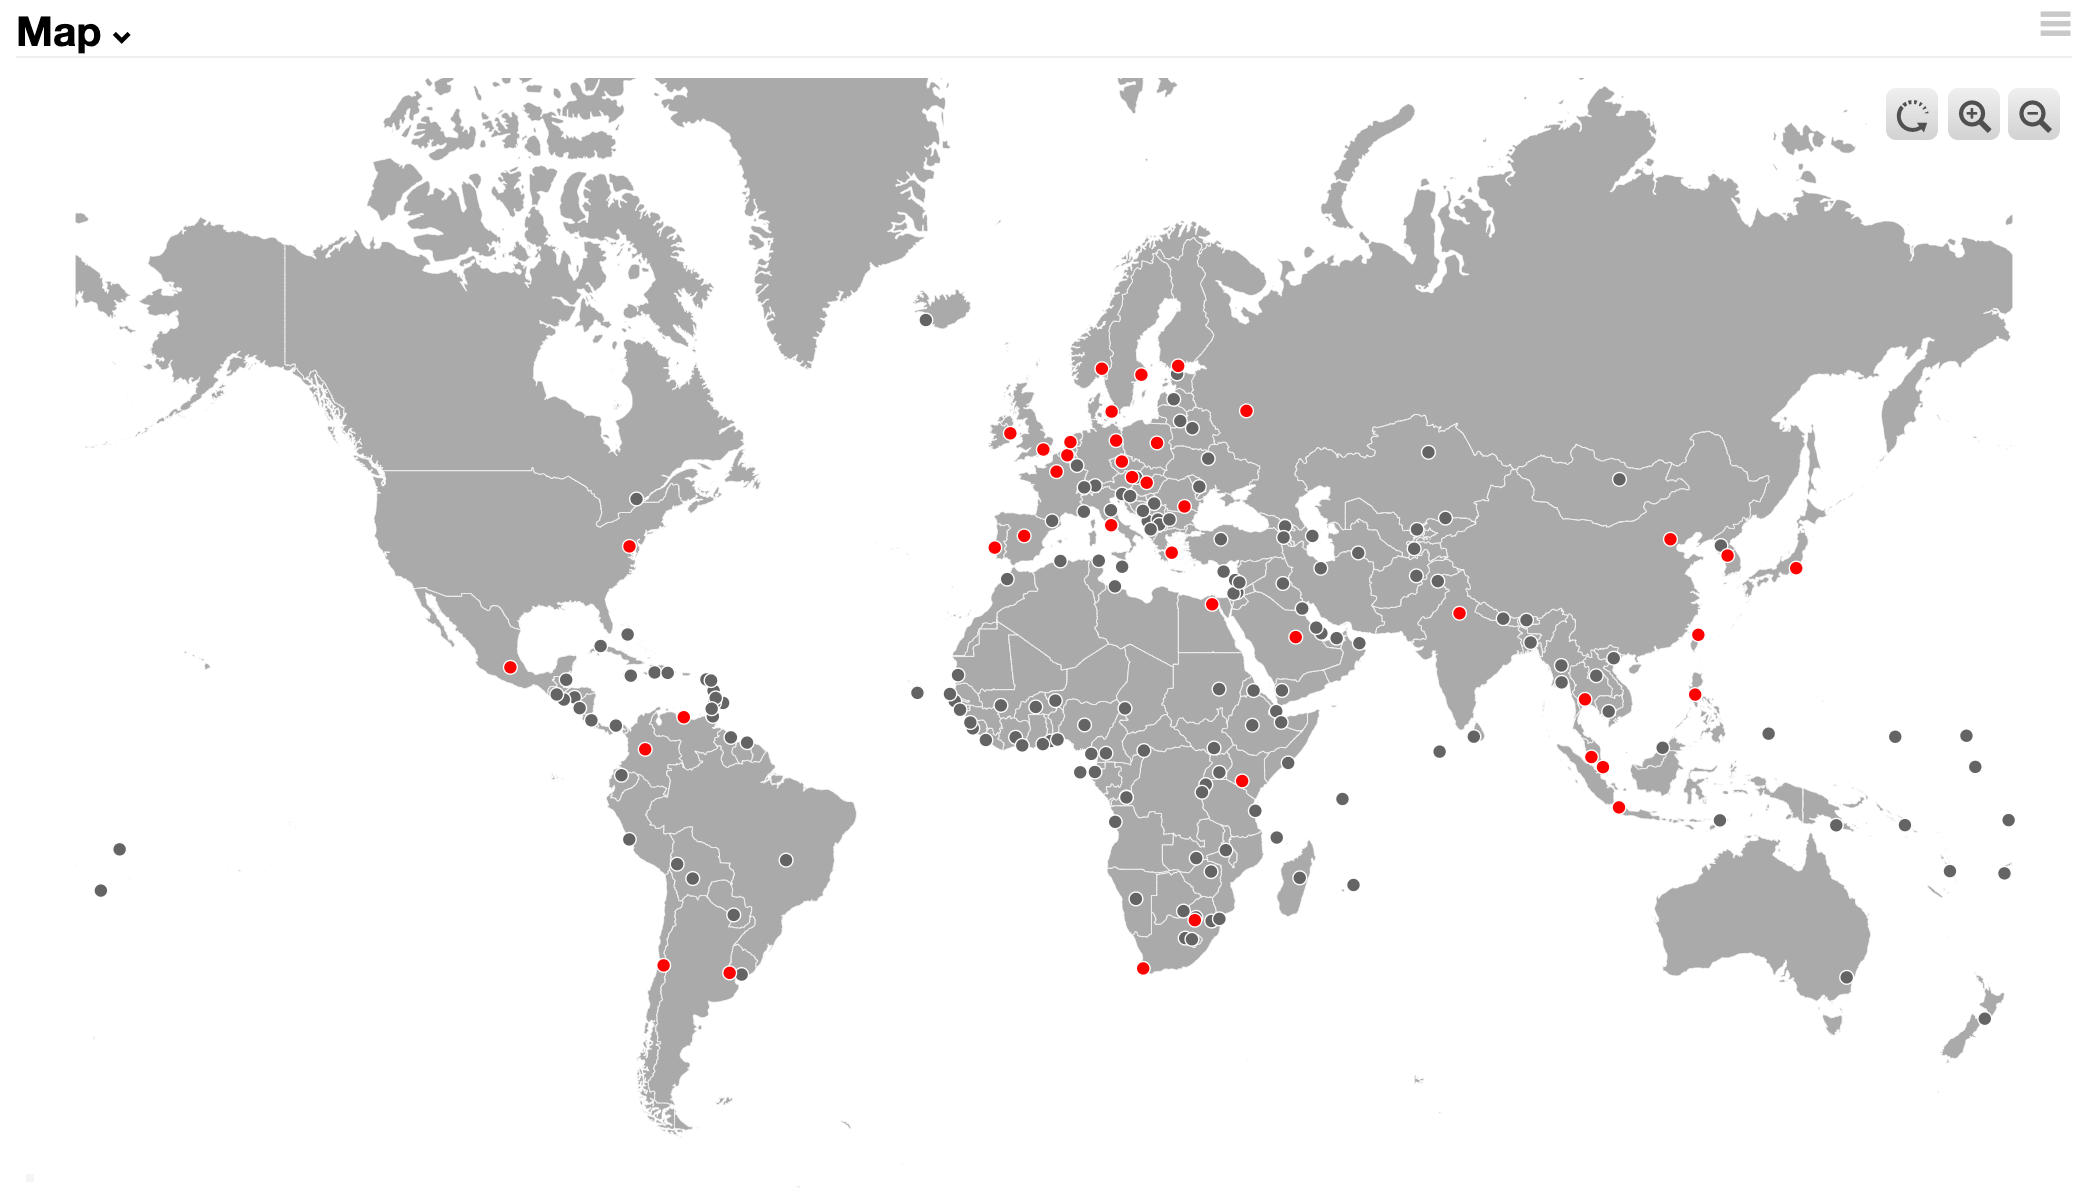
Zooming and panning
Maps can be zoomed with a mouse-wheel, or with the '+' and '-' buttons in the top right of the widget.
You can pan a map by clicking on any region or point. Maps can't be panned from whitespace (e.g. ocean), which makes it easier to scroll past a widget without unintentionally zooming.
Handling clicks with automations
On map widgets, a 'Map clicked' (map.clicked) automation can be added using event handler KATA.
The first enabled automation receives the event with inputs for the feature_type (region or point), feature_properties (from the GeoJSON), an optional widget_* dictionary, and the current worker_*.
The return dictionary may include a sheet: key with a schema to display for the clicked feature, using the feature properties.
Example: COVID-19 cases in the U.S.
Suppose we want to visualize COVID-19 cases in the United States by the severity of each state's incident rate (i.e. cases per 100K population). We'll call this "Covid-19 Incident Rate per 100K".
Choosing our resource and projection
We've learned that we can use the built-in map.country.usa.states resource to display a map of the United States.
Visualizations of the United States often use a compact format with a smaller Alaska, and larger Hawaii, shown closer to the continental states than their true locations. We'll use the albersUsa projection to achieve this effect.
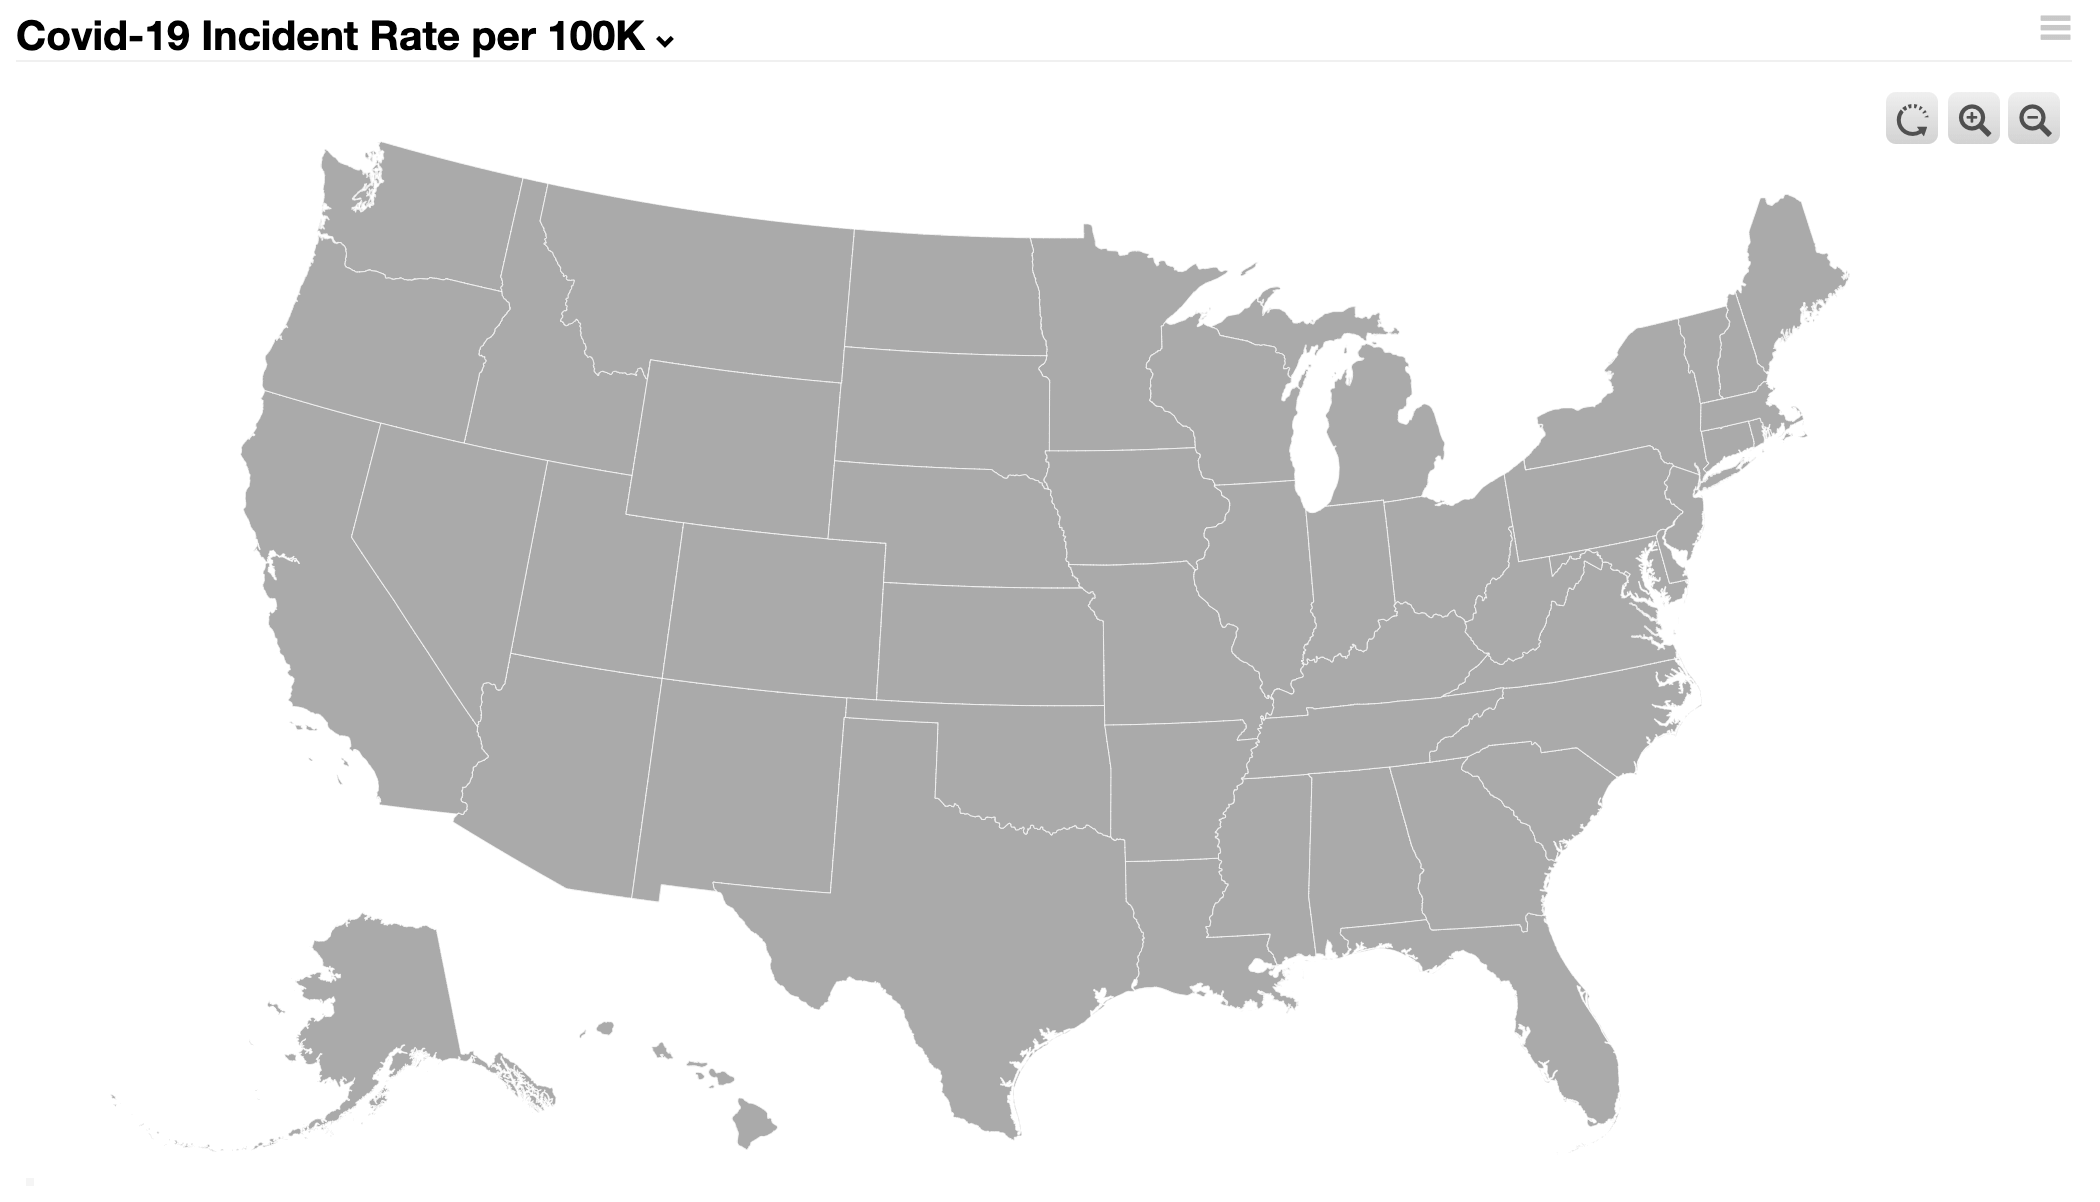
Our map KATA begins with:
map:
  resource:
    uri: cerb:resource:map.country.usa.states
  projection:
    type: albersUsa
    scale: 650
This shows all 50 states in a compact format, and scaled up to fill the widget:
Creating a properties resource
Now we want to colorize the states based on their incident rate. The map doesn't include this data by default, so we need to find some data for our new 'Map Properties' resource.
A quick search discovers a GitHub repository with daily reports of COVID-19 levels in the U.S.: https://github.com/CSSEGISandData/COVID-19/tree/master/csse_covid_19_data/csse_covid_19_daily_reports_us
We'll grab the latest report (2020-11-23, at the time of writing).
This is a comma-separated value file (.csv). We need to convert it to our 'Map Properties' JSON format.
For demonstration, we'll do the conversion manually, so you're better prepared to create your own resources.
You could write a simple script for this in any programming language; but you can also use the Setup » Developers » Bot Scripting Tester and write a quick and disposable script in Cerb's bot scripting language.
{# https://raw.githubusercontent.com/CSSEGISandData/COVID-19/master/csse_covid_19_data/csse_covid_19_daily_reports_us/11-23-2020.csv #}
{% set csv %}
Alabama,US,2020-11-24 05:30:26,32.3182,-86.9023,234080,3459,90702.0,139919.0,1.0,4774.039731317501,1533628.0,,1.4776999316473,84000001,USA,31278.199782386342,
Alaska,US,2020-11-24 05:30:26,61.3707,-152.4044,28273,103,7165.0,21005.0,2.0,3864.834015679145,933016.0,,0.3643051674742687,84000002,USA,127540.47939634607,
American Samoa,US,2020-11-24 05:30:26,-14.271,-170.132,0,0,,0.0,60.0,0.0,1988.0,,,16,ASM,3572.904872306393,
Arizona,US,2020-11-24 05:30:26,33.7298,-111.4312,302324,6464,48807.0,247053.0,4.0,4153.534201151109,2124873.0,,2.138103491618264,84000004,USA,29192.960792403388,
Arkansas,US,2020-11-24 05:30:26,34.9697,-92.3731,146190,2387,127059.0,16744.0,5.0,4844.250985153441,1605173.0,,1.6328066215199395,84000005,USA,53190.101146396526,
California,US,2020-11-24 05:30:26,36.1162,-119.6816,1128219,18753,,1109466.0,6.0,2855.3670594539817,22457544.0,,1.662177290047411,84000006,USA,56836.95397244544,
Colorado,US,2020-11-24 05:30:26,39.0598,-105.3111,202289,2810,11201.0,188278.0,8.0,3512.732655221563,2901740.0,,1.3891017306922275,84000008,USA,50388.48802931755,
Connecticut,US,2020-11-24 05:30:26,41.5978,-72.7554,106740,4871,9800.0,92069.0,9.0,2993.868375813785,3038489.0,,4.5634251452126655,84000009,USA,85224.24702415263,
Delaware,US,2020-11-24 05:30:26,39.3185,-75.5071,32211,752,16073.0,15386.0,10.0,3307.8856889348963,687482.0,,2.33460619043184,84000010,USA,70600.47403683027,
Diamond Princess,US,2020-11-24 05:30:26,,,49,0,,49.0,88888.0,,,,0.0,84088888,USA,,
District of Columbia,US,2020-11-24 05:30:26,38.8974,-77.0268,20290,672,14935.0,4683.0,11.0,2874.959794487842,639461.0,,3.3119763430261213,84000011,USA,90607.42558615033,
Florida,US,2020-11-24 05:30:26,27.7663,-81.6868,944745,18085,,926660.0,12.0,4398.7176116366445,11740720.0,,1.9142731636579184,84000012,USA,54664.60456238942,
Georgia,US,2020-11-24 05:30:26,33.0406,-83.6431,451056,9215,,441841.0,13.0,4248.262502115626,4139509.0,,2.0429835763186834,84000013,USA,38987.88811560018,
Grand Princess,US,2020-11-24 05:30:26,,,103,3,,100.0,99999.0,,,,2.9126213592233015,84099999,USA,,
Guam,US,2020-11-24 05:30:26,13.4443,144.7937,6452,103,4846.0,1503.0,66.0,3928.6605897862128,80999.0,,1.5964042157470553,316,GUM,49320.76551644351,
Hawaii,US,2020-11-24 05:30:26,21.0943,-157.4983,17596,233,11958.0,5405.0,15.0,1242.767707815396,636113.0,,1.3241645828597408,84000015,USA,44927.29568774577,
Idaho,US,2020-11-24 05:30:26,44.2405,-114.4788,93090,866,38025.0,54199.0,16.0,5209.099836883382,453872.0,,0.9302825222902568,84000016,USA,25397.6212392946,
Illinois,US,2020-11-24 05:30:26,40.3495,-88.9861,664620,12111,,652509.0,17.0,5244.86575370659,9892981.0,,1.8222442899702085,84000017,USA,78070.71296224908,
Indiana,US,2020-11-24 05:30:26,39.8494,-86.2583,300913,5332,169211.0,126370.0,18.0,4469.7446711106695,3939645.0,,1.771940727053999,84000018,USA,58519.2638563897,
Iowa,US,2020-11-24 05:30:26,42.0115,-93.2105,214792,2222,116837.0,95733.0,19.0,6807.836276215741,1040373.0,,1.0344891802301759,84000019,USA,32974.6408162101,
Kansas,US,2020-11-24 05:30:26,38.5266,-96.7265,144792,1348,3189.0,140255.0,20.0,4970.010098465185,784288.0,,0.9309906624675396,84000020,USA,26920.819383011923,
Kentucky,US,2020-11-24 05:30:26,37.6681,-84.6701,160232,1792,26611.0,131829.0,21.0,3586.475554500072,2441630.0,,1.1183783513904837,84000021,USA,54651.04540999309,
Louisiana,US,2020-11-24 05:30:26,31.1695,-91.8678,221160,6284,185960.0,28916.0,22.0,4757.3628773397995,3262192.0,,2.8413818050280337,84000022,USA,70172.86633909782,
Maine,US,2020-11-24 05:30:26,44.6939,-69.3819,10544,177,7986.0,2381.0,23.0,784.4000797493253,825349.0,,1.678679817905918,84000023,USA,61400.21068105329,
Maryland,US,2020-11-24 05:30:26,39.0639,-76.8021,183797,4448,8511.0,170838.0,24.0,3040.137751253788,4171674.0,,2.420061263241511,84000024,USA,69002.56050601421,
Massachusetts,US,2020-11-24 05:30:26,42.2302,-71.5301,208623,10531,145682.0,52410.0,25.0,3026.8104344677113,7920042.0,,5.047861453435144,84000025,USA,114908.06750464963,
Michigan,US,2020-11-24 05:30:26,43.3266,-84.5361,340964,8940,152267.0,179757.0,26.0,3414.1271873623505,6263536.0,,2.621977686793913,84000026,USA,62717.789991385675,
Minnesota,US,2020-11-24 05:30:26,45.6945,-93.9002,276500,3321,227311.0,45868.0,27.0,4902.80216865214,3756777.0,,1.2010849909584087,84000027,USA,66613.86771335434,
Mississippi,US,2020-11-24 05:30:26,32.7416,-89.6787,143879,3676,121637.0,18566.0,28.0,4834.4017722230965,1091151.0,,2.5549246241633594,84000028,USA,36663.184538139714,
Missouri,US,2020-11-24 05:30:26,38.4561,-92.2884,280645,3580,,277065.0,29.0,4572.680934098127,2942201.0,,1.2756329170304122,84000029,USA,47938.664209176866,
Montana,US,2020-11-24 05:30:26,46.9219,-110.4544,56381,614,39450.0,16317.0,30.0,5275.2769985909135,617974.0,,1.0890193504904135,84000030,USA,57820.61382251506,
Nebraska,US,2020-11-24 05:30:26,41.1254,-98.2681,115921,934,58057.0,56930.0,31.0,5992.58274366111,1262563.0,,0.8057211376713451,84000031,USA,65268.70236268668,
Nevada,US,2020-11-24 05:30:26,38.3135,-117.0554,136227,2023,,134204.0,32.0,4422.730537024748,1536076.0,,1.4850213247006834,84000032,USA,49870.07151585829,
New Hampshire,US,2020-11-24 05:30:26,43.4525,-71.5639,18082,512,13226.0,4344.0,33.0,1329.841414830063,770791.0,,2.831545183054972,84000033,USA,56687.85499271537,
New Jersey,US,2020-11-24 05:30:26,40.2989,-74.521,309588,16772,41550.0,251266.0,34.0,3485.4917537229,5675266.0,,5.4175226429964995,84000034,USA,63894.89529046328,
New Mexico,US,2020-11-24 05:30:26,34.8405,-106.2485,84148,1400,29183.0,53565.0,35.0,4013.1074112385895,1464452.0,,1.6637353234776822,84000035,USA,69841.26984126984,
New York,US,2020-11-24 05:30:26,42.1657,-74.9481,602120,34339,83307.0,484474.0,36.0,3095.1659698705034,18187840.0,,5.703016010097655,84000036,USA,93493.62823598208,
North Carolina,US,2020-11-24 05:30:26,35.6301,-79.8064,339194,5039,293555.0,40600.0,37.0,3234.089276935615,4983768.0,,1.4855805232403876,84000037,USA,47518.383720038866,
North Dakota,US,2020-11-24 05:30:26,47.5289,-99.784,73397,852,62697.0,9848.0,38.0,9631.368576310064,1033394.0,,1.1608103873455318,84000038,USA,135604.9770228669,
Northern Mariana Islands,US,2020-11-24 05:30:26,15.0979,145.6739,104,2,29.0,73.0,69.0,188.59712752067315,16851.0,,1.9230769230769231,580,MNP,30558.174960104454,
Ohio,US,2020-11-24 05:30:26,40.3888,-82.7649,363304,6020,230678.0,126606.0,39.0,3108.0579343148747,5683989.0,,1.6570145112632946,84000039,USA,48626.404085857765,
Oklahoma,US,2020-11-24 05:30:26,35.5653,-96.9289,177874,1649,142381.0,33844.0,40.0,4495.206055338793,1967519.0,,0.927060728380764,84000040,USA,49722.856194801534,
Oregon,US,2020-11-24 05:30:26,44.572,-122.0709,66333,826,5870.0,59637.0,41.0,1572.7154158734884,1016282.0,,1.2452323881024527,84000041,USA,24095.43316712256,
Pennsylvania,US,2020-11-24 05:30:26,40.5908,-77.2098,320158,9846,198072.0,112240.0,42.0,2500.8457670132348,3019571.0,,3.0753565427070386,84000042,USA,23586.733280273867,
Puerto Rico,US,2020-11-24 05:30:26,18.2208,-66.5901,48200,1032,39214.0,7954.0,72.0,1509.224114771171,354172.0,,2.1410788381742742,630,PRI,11089.728696612763,
Rhode Island,US,2020-11-24 05:30:26,41.6809,-71.5118,50573,1309,3436.0,45828.0,44.0,4773.915596288706,1468082.0,,2.588337650524984,84000044,USA,138581.84320547953,
South Carolina,US,2020-11-24 05:30:26,33.8569,-80.945,207552,4288,108469.0,94795.0,45.0,4031.1425338443737,2267605.0,,2.065988282454517,84000045,USA,44042.16276141965,
South Dakota,US,2020-11-24 05:30:26,44.2998,-99.4388,73848,819,55679.0,17350.0,46.0,8347.623208490502,313297.0,,1.1090347741306468,84000046,USA,35414.436522999255,
Tennessee,US,2020-11-24 05:30:26,35.7478,-86.6923,344550,4301,296592.0,43657.0,47.0,5045.2660892810745,4334644.0,,1.248294877376288,84000047,USA,63472.44923031687,
Texas,US,2020-11-24 05:30:26,31.0545,-97.5635,1162135,21049,917739.0,221075.0,48.0,4000.0957377359914,10123856.0,,1.814783297682571,84000048,USA,34914.807382469255,
Utah,US,2020-11-24 05:30:26,40.15,-111.8624,179420,797,117104.0,61519.0,49.0,5596.4551001603895,1735824.0,,0.44420911826998105,84000049,USA,54143.69121491922,
Vermont,US,2020-11-24 05:30:26,44.0459,-72.7107,3714,63,2300.0,1351.0,50.0,595.2028000493599,523227.0,,1.6962843295638126,84000050,USA,83851.95892876317,
Virgin Islands,US,2020-11-24 05:30:26,18.3358,-64.8963,1507,23,1407.0,77.0,78.0,1404.8924189879556,27479.0,,1.5262110152621102,850,VIR,25617.145840325167,
Virginia,US,2020-11-24 05:30:26,37.7693,-78.17,221038,3942,23253.0,193843.0,51.0,2589.625774367089,3161059.0,,1.7834037586297378,84000051,USA,37034.174488979515,
Washington,US,2020-11-24 05:30:26,47.4009,-121.4905,147537,2655,,144882.0,53.0,1937.4796205278265,2894367.0,,1.7995485878118709,84000053,USA,38009.29310497206,
West Virginia,US,2020-11-24 05:30:26,38.4912,-80.9545,41114,667,26769.0,13678.0,54.0,2294.1198461956524,1038846.0,,1.6223184316777741,84000054,USA,57966.56189475529,
Wisconsin,US,2020-11-24 05:30:26,44.2685,-89.6165,379693,3158,280358.0,96177.0,55.0,6521.207453789943,4196070.0,,0.8317245774876019,84000055,USA,72067.28320149271,
Wyoming,US,2020-11-24 05:30:26,42.756,-107.3025,29431,202,17452.0,11777.0,56.0,5085.190899839138,161219.0,,0.6863511263633584,84000056,USA,27855.98150525521,
{% endset %}
{% set results = [] %}
{% for line in csv|split_crlf %}
{% set data = line|split_csv %}
{# Province_State,Country_Region,Last_Update,Lat,Long_,Confirmed,Deaths,Recovered,Active,FIPS,Incident_Rate,Total_Test_Results,People_Hospitalized,Case_Fatality_Ratio,UID,ISO3,Testing_Rate,Hospitalization_Rate #}
{% set results = dict_set(results, data.0, {
	covid_incident_rate: data.10|round(2),
	covid_testing_rate: data.16|round(2),
	covid_cases_confirmed: data.5|round,
	covid_deaths: data.6|round,
	covid_recovered: data.7|round,
	covid_active: data.8|round,
	covid_fips: data.9|round,
}) %}
{% endfor %}
{{results|json_encode|json_pretty}}
Omitting |json_pretty gives more compact output, and will often produce a considerably smaller file for large data sets.
Don't worry if the above script doesn't make sense to you. It's not important for this example.
This script gives us the following JSON output:
{
  "Alabama": {
    "covid_incident_rate": 4774.04,
    "covid_testing_rate": 31278.2,
    "covid_cases_confirmed": 234080,
    "covid_deaths": 3459,
    "covid_recovered": 90702,
    "covid_active": 139919,
    "covid_fips": 1
  },
  "Alaska": {
    "covid_incident_rate": 3864.83,
    "covid_testing_rate": 127540.48,
    "covid_cases_confirmed": 28273,
    "covid_deaths": 103,
    "covid_recovered": 7165,
    "covid_active": 21005,
    "covid_fips": 2
  },
  "American Samoa": {
    "covid_incident_rate": 0,
    "covid_testing_rate": 3572.9,
    "covid_cases_confirmed": 0,
    "covid_deaths": 0,
    "covid_recovered": 0,
    "covid_active": 0,
    "covid_fips": 60
  },
  "Arizona": {
    "covid_incident_rate": 4153.53,
    "covid_testing_rate": 29192.96,
    "covid_cases_confirmed": 302324,
    "covid_deaths": 6464,
    "covid_recovered": 48807,
    "covid_active": 247053,
    "covid_fips": 4
  },
  "Arkansas": {
    "covid_incident_rate": 4844.25,
    "covid_testing_rate": 53190.1,
    "covid_cases_confirmed": 146190,
    "covid_deaths": 2387,
    "covid_recovered": 127059,
    "covid_active": 16744,
    "covid_fips": 5
  },
  "California": {
    "covid_incident_rate": 2855.37,
    "covid_testing_rate": 56836.95,
    "covid_cases_confirmed": 1128219,
    "covid_deaths": 18753,
    "covid_recovered": 0,
    "covid_active": 1109466,
    "covid_fips": 6
  },
  "Colorado": {
    "covid_incident_rate": 3512.73,
    "covid_testing_rate": 50388.49,
    "covid_cases_confirmed": 202289,
    "covid_deaths": 2810,
    "covid_recovered": 11201,
    "covid_active": 188278,
    "covid_fips": 8
  },
  "Connecticut": {
    "covid_incident_rate": 2993.87,
    "covid_testing_rate": 85224.25,
    "covid_cases_confirmed": 106740,
    "covid_deaths": 4871,
    "covid_recovered": 9800,
    "covid_active": 92069,
    "covid_fips": 9
  },
  "Delaware": {
    "covid_incident_rate": 3307.89,
    "covid_testing_rate": 70600.47,
    "covid_cases_confirmed": 32211,
    "covid_deaths": 752,
    "covid_recovered": 16073,
    "covid_active": 15386,
    "covid_fips": 10
  },
  "Diamond Princess": {
    "covid_incident_rate": 0,
    "covid_testing_rate": 0,
    "covid_cases_confirmed": 49,
    "covid_deaths": 0,
    "covid_recovered": 0,
    "covid_active": 49,
    "covid_fips": 88888
  },
  "District of Columbia": {
    "covid_incident_rate": 2874.96,
    "covid_testing_rate": 90607.43,
    "covid_cases_confirmed": 20290,
    "covid_deaths": 672,
    "covid_recovered": 14935,
    "covid_active": 4683,
    "covid_fips": 11
  },
  "Florida": {
    "covid_incident_rate": 4398.72,
    "covid_testing_rate": 54664.6,
    "covid_cases_confirmed": 944745,
    "covid_deaths": 18085,
    "covid_recovered": 0,
    "covid_active": 926660,
    "covid_fips": 12
  },
  "Georgia": {
    "covid_incident_rate": 4248.26,
    "covid_testing_rate": 38987.89,
    "covid_cases_confirmed": 451056,
    "covid_deaths": 9215,
    "covid_recovered": 0,
    "covid_active": 441841,
    "covid_fips": 13
  },
  "Grand Princess": {
    "covid_incident_rate": 0,
    "covid_testing_rate": 0,
    "covid_cases_confirmed": 103,
    "covid_deaths": 3,
    "covid_recovered": 0,
    "covid_active": 100,
    "covid_fips": 99999
  },
  "Guam": {
    "covid_incident_rate": 3928.66,
    "covid_testing_rate": 49320.77,
    "covid_cases_confirmed": 6452,
    "covid_deaths": 103,
    "covid_recovered": 4846,
    "covid_active": 1503,
    "covid_fips": 66
  },
  "Hawaii": {
    "covid_incident_rate": 1242.77,
    "covid_testing_rate": 44927.3,
    "covid_cases_confirmed": 17596,
    "covid_deaths": 233,
    "covid_recovered": 11958,
    "covid_active": 5405,
    "covid_fips": 15
  },
  "Idaho": {
    "covid_incident_rate": 5209.1,
    "covid_testing_rate": 25397.62,
    "covid_cases_confirmed": 93090,
    "covid_deaths": 866,
    "covid_recovered": 38025,
    "covid_active": 54199,
    "covid_fips": 16
  },
  "Illinois": {
    "covid_incident_rate": 5244.87,
    "covid_testing_rate": 78070.71,
    "covid_cases_confirmed": 664620,
    "covid_deaths": 12111,
    "covid_recovered": 0,
    "covid_active": 652509,
    "covid_fips": 17
  },
  "Indiana": {
    "covid_incident_rate": 4469.74,
    "covid_testing_rate": 58519.26,
    "covid_cases_confirmed": 300913,
    "covid_deaths": 5332,
    "covid_recovered": 169211,
    "covid_active": 126370,
    "covid_fips": 18
  },
  "Iowa": {
    "covid_incident_rate": 6807.84,
    "covid_testing_rate": 32974.64,
    "covid_cases_confirmed": 214792,
    "covid_deaths": 2222,
    "covid_recovered": 116837,
    "covid_active": 95733,
    "covid_fips": 19
  },
  "Kansas": {
    "covid_incident_rate": 4970.01,
    "covid_testing_rate": 26920.82,
    "covid_cases_confirmed": 144792,
    "covid_deaths": 1348,
    "covid_recovered": 3189,
    "covid_active": 140255,
    "covid_fips": 20
  },
  "Kentucky": {
    "covid_incident_rate": 3586.48,
    "covid_testing_rate": 54651.05,
    "covid_cases_confirmed": 160232,
    "covid_deaths": 1792,
    "covid_recovered": 26611,
    "covid_active": 131829,
    "covid_fips": 21
  },
  "Louisiana": {
    "covid_incident_rate": 4757.36,
    "covid_testing_rate": 70172.87,
    "covid_cases_confirmed": 221160,
    "covid_deaths": 6284,
    "covid_recovered": 185960,
    "covid_active": 28916,
    "covid_fips": 22
  },
  "Maine": {
    "covid_incident_rate": 784.4,
    "covid_testing_rate": 61400.21,
    "covid_cases_confirmed": 10544,
    "covid_deaths": 177,
    "covid_recovered": 7986,
    "covid_active": 2381,
    "covid_fips": 23
  },
  "Maryland": {
    "covid_incident_rate": 3040.14,
    "covid_testing_rate": 69002.56,
    "covid_cases_confirmed": 183797,
    "covid_deaths": 4448,
    "covid_recovered": 8511,
    "covid_active": 170838,
    "covid_fips": 24
  },
  "Massachusetts": {
    "covid_incident_rate": 3026.81,
    "covid_testing_rate": 114908.07,
    "covid_cases_confirmed": 208623,
    "covid_deaths": 10531,
    "covid_recovered": 145682,
    "covid_active": 52410,
    "covid_fips": 25
  },
  "Michigan": {
    "covid_incident_rate": 3414.13,
    "covid_testing_rate": 62717.79,
    "covid_cases_confirmed": 340964,
    "covid_deaths": 8940,
    "covid_recovered": 152267,
    "covid_active": 179757,
    "covid_fips": 26
  },
  "Minnesota": {
    "covid_incident_rate": 4902.8,
    "covid_testing_rate": 66613.87,
    "covid_cases_confirmed": 276500,
    "covid_deaths": 3321,
    "covid_recovered": 227311,
    "covid_active": 45868,
    "covid_fips": 27
  },
  "Mississippi": {
    "covid_incident_rate": 4834.4,
    "covid_testing_rate": 36663.18,
    "covid_cases_confirmed": 143879,
    "covid_deaths": 3676,
    "covid_recovered": 121637,
    "covid_active": 18566,
    "covid_fips": 28
  },
  "Missouri": {
    "covid_incident_rate": 4572.68,
    "covid_testing_rate": 47938.66,
    "covid_cases_confirmed": 280645,
    "covid_deaths": 3580,
    "covid_recovered": 0,
    "covid_active": 277065,
    "covid_fips": 29
  },
  "Montana": {
    "covid_incident_rate": 5275.28,
    "covid_testing_rate": 57820.61,
    "covid_cases_confirmed": 56381,
    "covid_deaths": 614,
    "covid_recovered": 39450,
    "covid_active": 16317,
    "covid_fips": 30
  },
  "Nebraska": {
    "covid_incident_rate": 5992.58,
    "covid_testing_rate": 65268.7,
    "covid_cases_confirmed": 115921,
    "covid_deaths": 934,
    "covid_recovered": 58057,
    "covid_active": 56930,
    "covid_fips": 31
  },
  "Nevada": {
    "covid_incident_rate": 4422.73,
    "covid_testing_rate": 49870.07,
    "covid_cases_confirmed": 136227,
    "covid_deaths": 2023,
    "covid_recovered": 0,
    "covid_active": 134204,
    "covid_fips": 32
  },
  "New Hampshire": {
    "covid_incident_rate": 1329.84,
    "covid_testing_rate": 56687.85,
    "covid_cases_confirmed": 18082,
    "covid_deaths": 512,
    "covid_recovered": 13226,
    "covid_active": 4344,
    "covid_fips": 33
  },
  "New Jersey": {
    "covid_incident_rate": 3485.49,
    "covid_testing_rate": 63894.9,
    "covid_cases_confirmed": 309588,
    "covid_deaths": 16772,
    "covid_recovered": 41550,
    "covid_active": 251266,
    "covid_fips": 34
  },
  "New Mexico": {
    "covid_incident_rate": 4013.11,
    "covid_testing_rate": 69841.27,
    "covid_cases_confirmed": 84148,
    "covid_deaths": 1400,
    "covid_recovered": 29183,
    "covid_active": 53565,
    "covid_fips": 35
  },
  "New York": {
    "covid_incident_rate": 3095.17,
    "covid_testing_rate": 93493.63,
    "covid_cases_confirmed": 602120,
    "covid_deaths": 34339,
    "covid_recovered": 83307,
    "covid_active": 484474,
    "covid_fips": 36
  },
  "North Carolina": {
    "covid_incident_rate": 3234.09,
    "covid_testing_rate": 47518.38,
    "covid_cases_confirmed": 339194,
    "covid_deaths": 5039,
    "covid_recovered": 293555,
    "covid_active": 40600,
    "covid_fips": 37
  },
  "North Dakota": {
    "covid_incident_rate": 9631.37,
    "covid_testing_rate": 135604.98,
    "covid_cases_confirmed": 73397,
    "covid_deaths": 852,
    "covid_recovered": 62697,
    "covid_active": 9848,
    "covid_fips": 38
  },
  "Northern Mariana Islands": {
    "covid_incident_rate": 188.6,
    "covid_testing_rate": 30558.17,
    "covid_cases_confirmed": 104,
    "covid_deaths": 2,
    "covid_recovered": 29,
    "covid_active": 73,
    "covid_fips": 69
  },
  "Ohio": {
    "covid_incident_rate": 3108.06,
    "covid_testing_rate": 48626.4,
    "covid_cases_confirmed": 363304,
    "covid_deaths": 6020,
    "covid_recovered": 230678,
    "covid_active": 126606,
    "covid_fips": 39
  },
  "Oklahoma": {
    "covid_incident_rate": 4495.21,
    "covid_testing_rate": 49722.86,
    "covid_cases_confirmed": 177874,
    "covid_deaths": 1649,
    "covid_recovered": 142381,
    "covid_active": 33844,
    "covid_fips": 40
  },
  "Oregon": {
    "covid_incident_rate": 1572.72,
    "covid_testing_rate": 24095.43,
    "covid_cases_confirmed": 66333,
    "covid_deaths": 826,
    "covid_recovered": 5870,
    "covid_active": 59637,
    "covid_fips": 41
  },
  "Pennsylvania": {
    "covid_incident_rate": 2500.85,
    "covid_testing_rate": 23586.73,
    "covid_cases_confirmed": 320158,
    "covid_deaths": 9846,
    "covid_recovered": 198072,
    "covid_active": 112240,
    "covid_fips": 42
  },
  "Puerto Rico": {
    "covid_incident_rate": 1509.22,
    "covid_testing_rate": 11089.73,
    "covid_cases_confirmed": 48200,
    "covid_deaths": 1032,
    "covid_recovered": 39214,
    "covid_active": 7954,
    "covid_fips": 72
  },
  "Rhode Island": {
    "covid_incident_rate": 4773.92,
    "covid_testing_rate": 138581.84,
    "covid_cases_confirmed": 50573,
    "covid_deaths": 1309,
    "covid_recovered": 3436,
    "covid_active": 45828,
    "covid_fips": 44
  },
  "South Carolina": {
    "covid_incident_rate": 4031.14,
    "covid_testing_rate": 44042.16,
    "covid_cases_confirmed": 207552,
    "covid_deaths": 4288,
    "covid_recovered": 108469,
    "covid_active": 94795,
    "covid_fips": 45
  },
  "South Dakota": {
    "covid_incident_rate": 8347.62,
    "covid_testing_rate": 35414.44,
    "covid_cases_confirmed": 73848,
    "covid_deaths": 819,
    "covid_recovered": 55679,
    "covid_active": 17350,
    "covid_fips": 46
  },
  "Tennessee": {
    "covid_incident_rate": 5045.27,
    "covid_testing_rate": 63472.45,
    "covid_cases_confirmed": 344550,
    "covid_deaths": 4301,
    "covid_recovered": 296592,
    "covid_active": 43657,
    "covid_fips": 47
  },
  "Texas": {
    "covid_incident_rate": 4000.1,
    "covid_testing_rate": 34914.81,
    "covid_cases_confirmed": 1162135,
    "covid_deaths": 21049,
    "covid_recovered": 917739,
    "covid_active": 221075,
    "covid_fips": 48
  },
  "Utah": {
    "covid_incident_rate": 5596.46,
    "covid_testing_rate": 54143.69,
    "covid_cases_confirmed": 179420,
    "covid_deaths": 797,
    "covid_recovered": 117104,
    "covid_active": 61519,
    "covid_fips": 49
  },
  "Vermont": {
    "covid_incident_rate": 595.2,
    "covid_testing_rate": 83851.96,
    "covid_cases_confirmed": 3714,
    "covid_deaths": 63,
    "covid_recovered": 2300,
    "covid_active": 1351,
    "covid_fips": 50
  },
  "Virgin Islands": {
    "covid_incident_rate": 1404.89,
    "covid_testing_rate": 25617.15,
    "covid_cases_confirmed": 1507,
    "covid_deaths": 23,
    "covid_recovered": 1407,
    "covid_active": 77,
    "covid_fips": 78
  },
  "Virginia": {
    "covid_incident_rate": 2589.63,
    "covid_testing_rate": 37034.17,
    "covid_cases_confirmed": 221038,
    "covid_deaths": 3942,
    "covid_recovered": 23253,
    "covid_active": 193843,
    "covid_fips": 51
  },
  "Washington": {
    "covid_incident_rate": 1937.48,
    "covid_testing_rate": 38009.29,
    "covid_cases_confirmed": 147537,
    "covid_deaths": 2655,
    "covid_recovered": 0,
    "covid_active": 144882,
    "covid_fips": 53
  },
  "West Virginia": {
    "covid_incident_rate": 2294.12,
    "covid_testing_rate": 57966.56,
    "covid_cases_confirmed": 41114,
    "covid_deaths": 667,
    "covid_recovered": 26769,
    "covid_active": 13678,
    "covid_fips": 54
  },
  "Wisconsin": {
    "covid_incident_rate": 6521.21,
    "covid_testing_rate": 72067.28,
    "covid_cases_confirmed": 379693,
    "covid_deaths": 3158,
    "covid_recovered": 280358,
    "covid_active": 96177,
    "covid_fips": 55
  },
  "Wyoming": {
    "covid_incident_rate": 5085.19,
    "covid_testing_rate": 27855.98,
    "covid_cases_confirmed": 29431,
    "covid_deaths": 202,
    "covid_recovered": 17452,
    "covid_active": 11777,
    "covid_fips": 56
  }
}
We can copy the output above and save it to a file with a name like usa-covid-2020-11-23.json.txt.
Now we can create a new resource in Cerb from Search » Resources by clicking the (+) icon above the list.
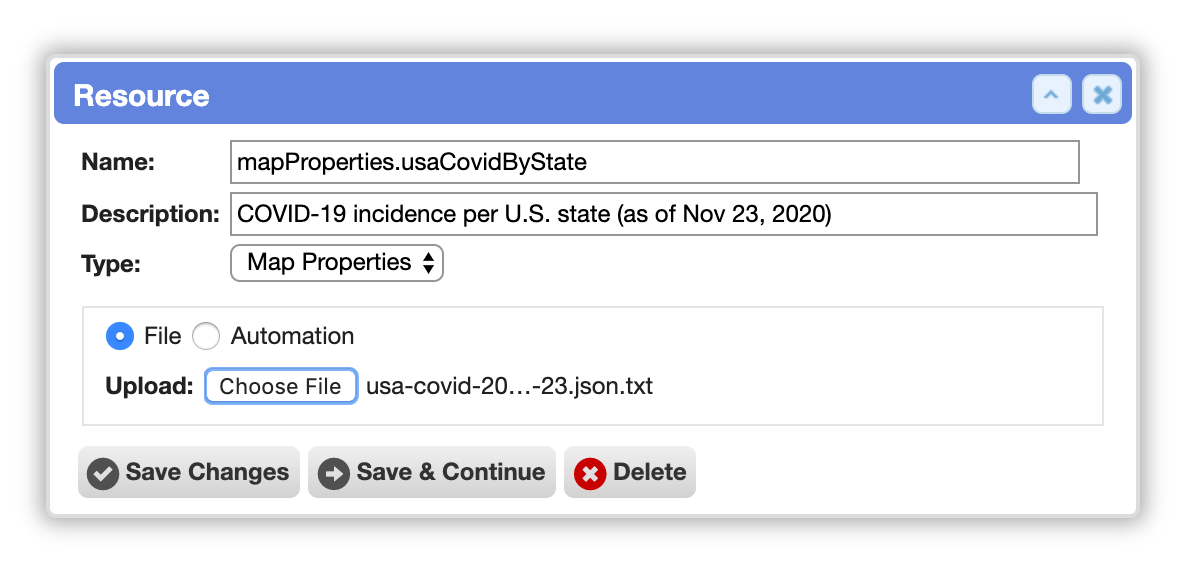
After saving the file, we can refer to it by name in our map KATA.
map:
resource:
uri: cerb:resource:map.country.usa.states
projection:
type: albersUsa
scale: 650
regions:
properties:
join:
property: name
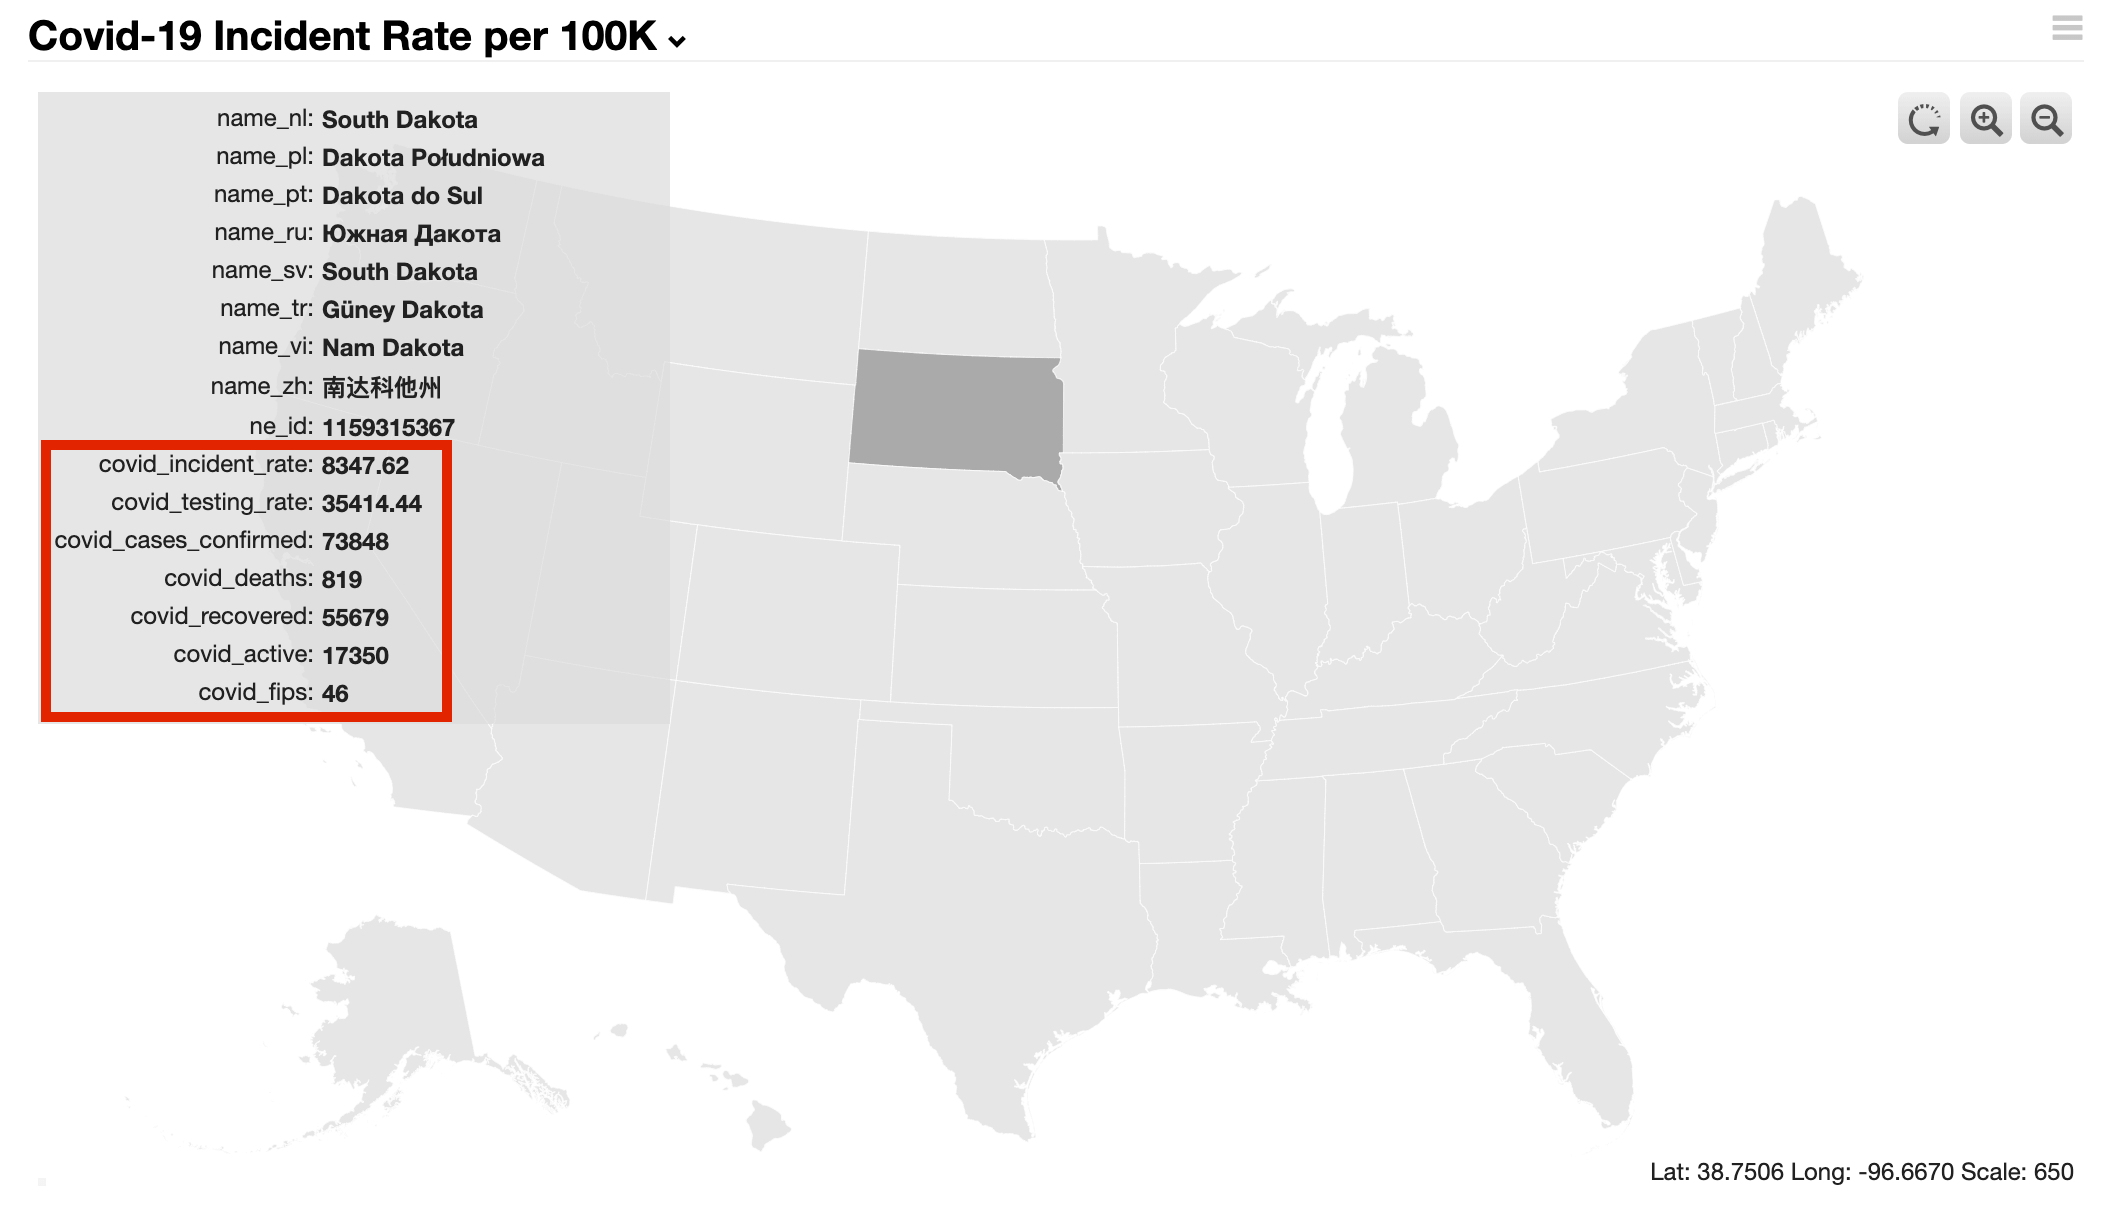
resource:
uri: cerb:resource:mapProperties.usaCovidByStateThe map doesn't look any different yet, but if you click on any state then you'll see that the new covid_ properties have been merged into the bottom of the list:
We can use the map:regions:fill:choropleth feature and the covid_incident_rate property to colorize the map.
map:
resource:
uri: cerb:resource:map.country.usa.states
projection:
type: albersUsa
scale: 650
regions:
properties:
join:
property: name
resource:
uri: cerb:resource:mapProperties.usaCovidByState
fill:
choropleth:
property: covid_incident_rate
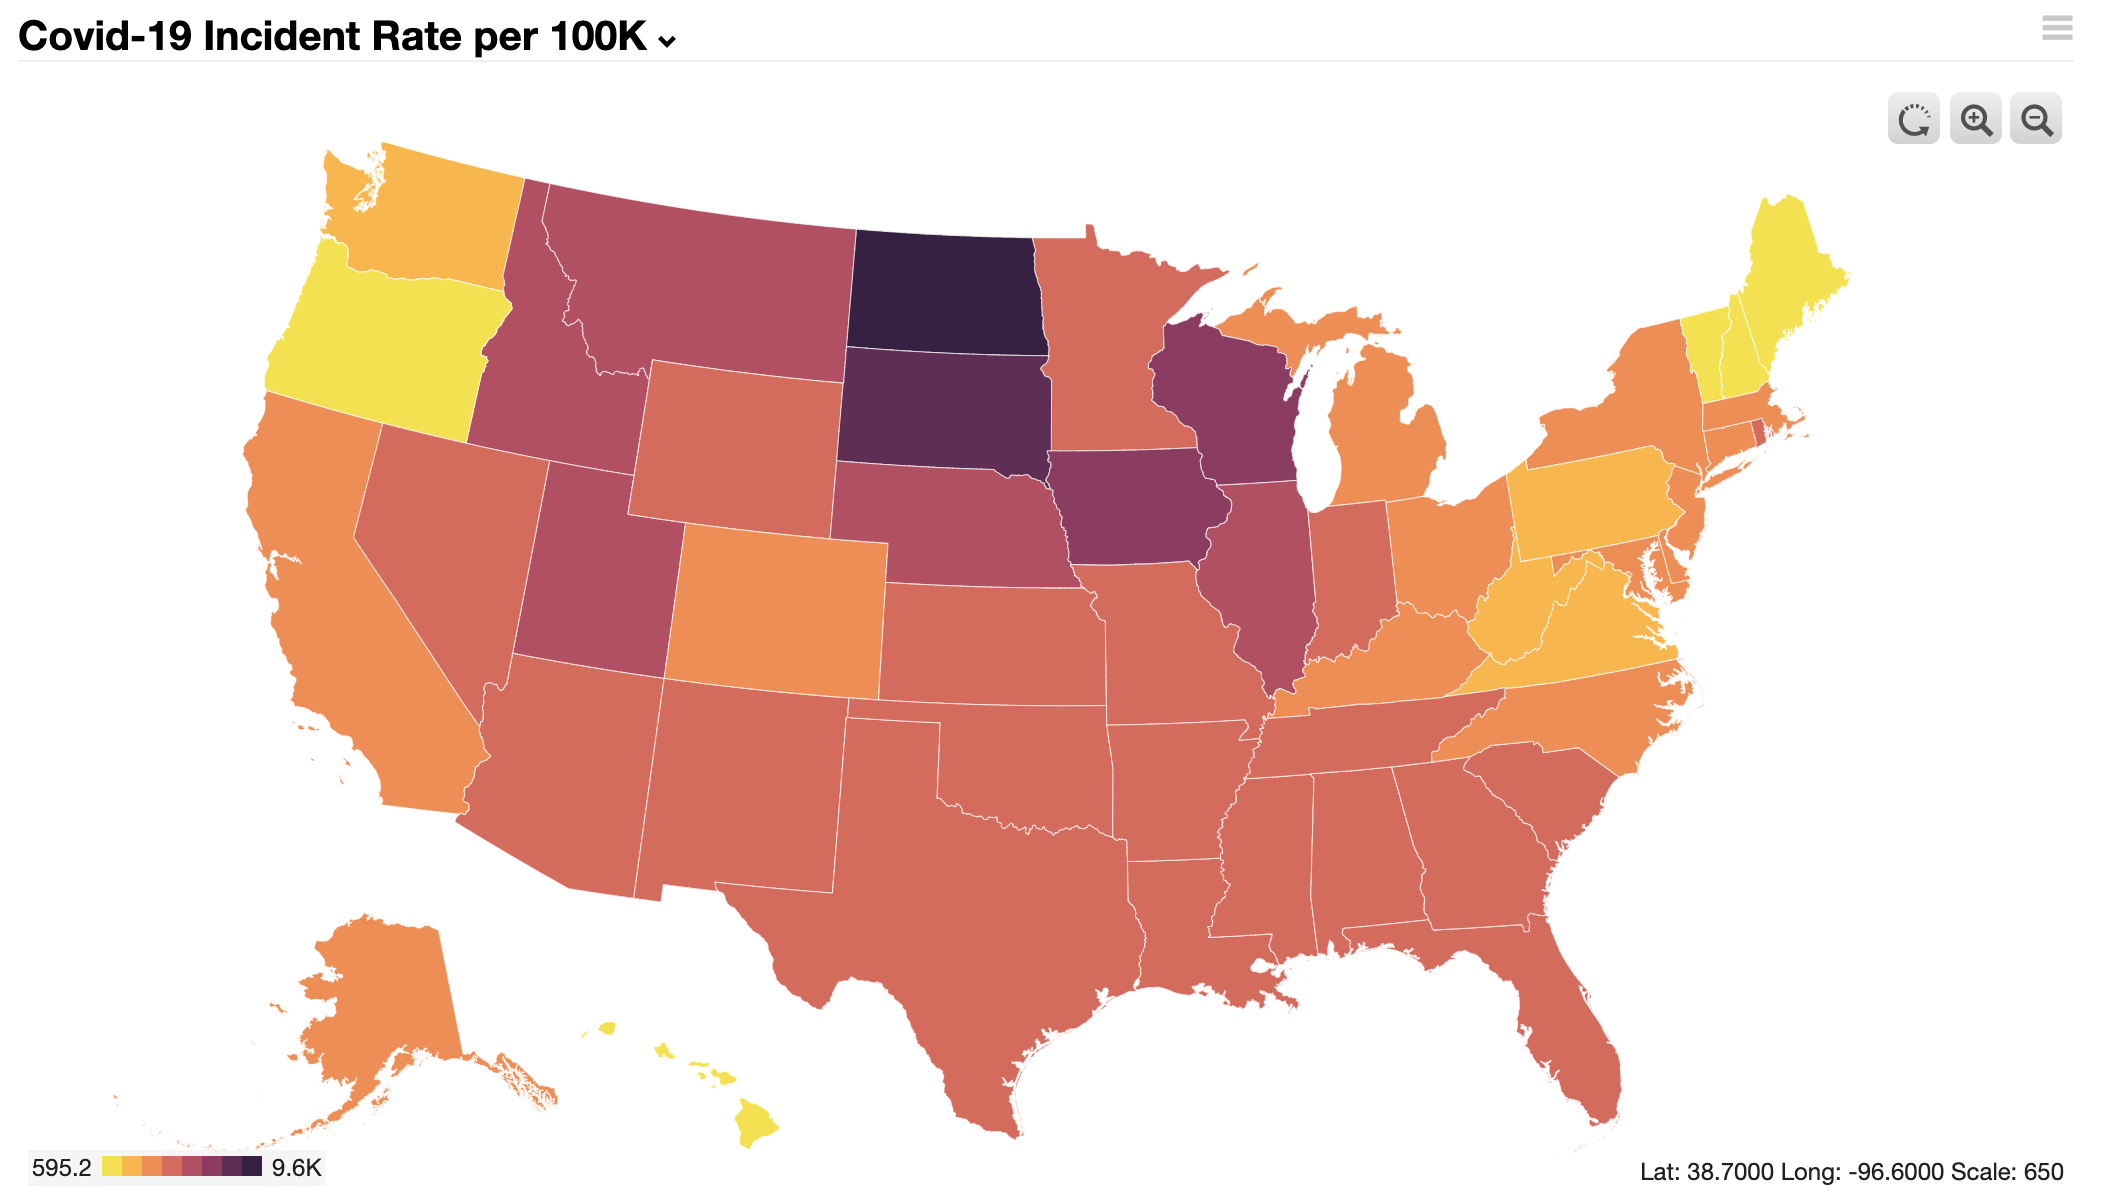
classes: 8We can now easily see that the darker states have a higher incidence rate of the virus:
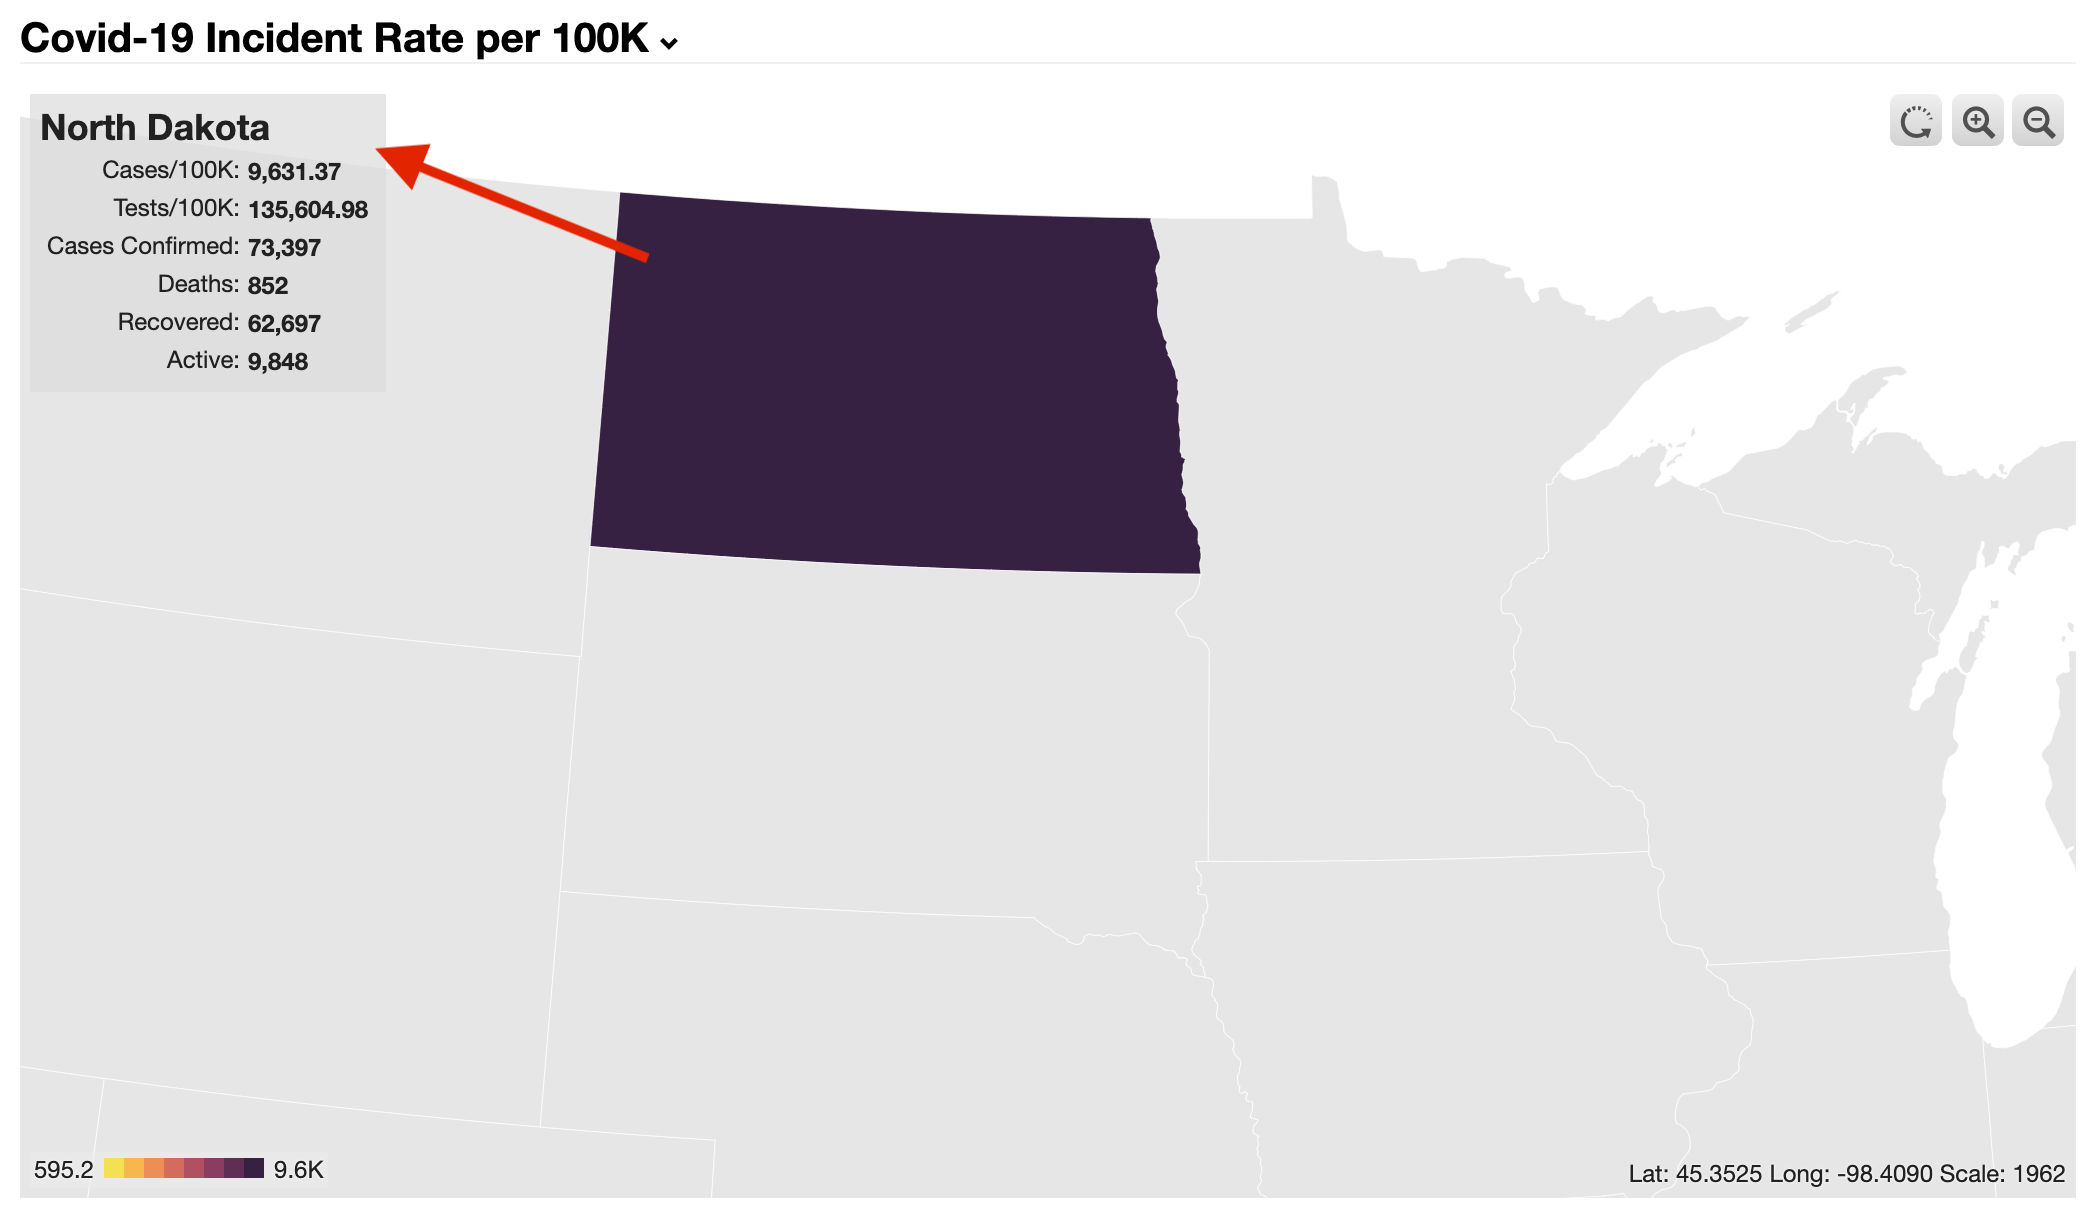
Simplifying the labels
Now we can configure the labels to only show the virus-related properties:
map:
  resource:
    uri: cerb:resource:map.country.usa.states
  projection:
    type: albersUsa
    scale: 650
  regions:
    properties:
      join:
        property: name
      resource:
        uri: cerb:resource:mapProperties.usaCovidByState
    fill:
      choropleth:
        property: covid_incident_rate
        classes: 8
    label:
      title: name_en
      properties:
        covid_incident_rate:
          label: Cases/100K
          format: number
        covid_testing_rate:
          label: Tests/100K
          format: number
        covid_cases_confirmed:
          label: Cases Confirmed
          format: number
        covid_deaths:
          label: Deaths
          format: number
        covid_recovered:
          label: Recovered
          format: number
        covid_active:
          label: Active
          format: number
And we see a much more readable label:
Conclusion
You can use the same process to gather and visualize data from anywhere.
In production, we'd create a resource automation to pull the latest report via HTTP and automatically convert it from CSV to JSON. We'd only need to do that once, and we'd always have the latest data in the widget.
A resource automation could also fetch properties using a data query.
For instance, you could colorize countries or regions based on the number of clients you have in that area, with the darker regions having a higher density of clients.
References
-
GeoJSON: https://en.wikipedia.org/wiki/GeoJSON ↩